Creek vs Scandinavian Bachelor's Degree
COMPARE
Creek
Scandinavian
Bachelor's Degree
Bachelor's Degree Comparison
Creek
Scandinavians
28.9%
BACHELOR'S DEGREE
0.0/ 100
METRIC RATING
319th/ 347
METRIC RANK
37.5%
BACHELOR'S DEGREE
41.7/ 100
METRIC RATING
184th/ 347
METRIC RANK
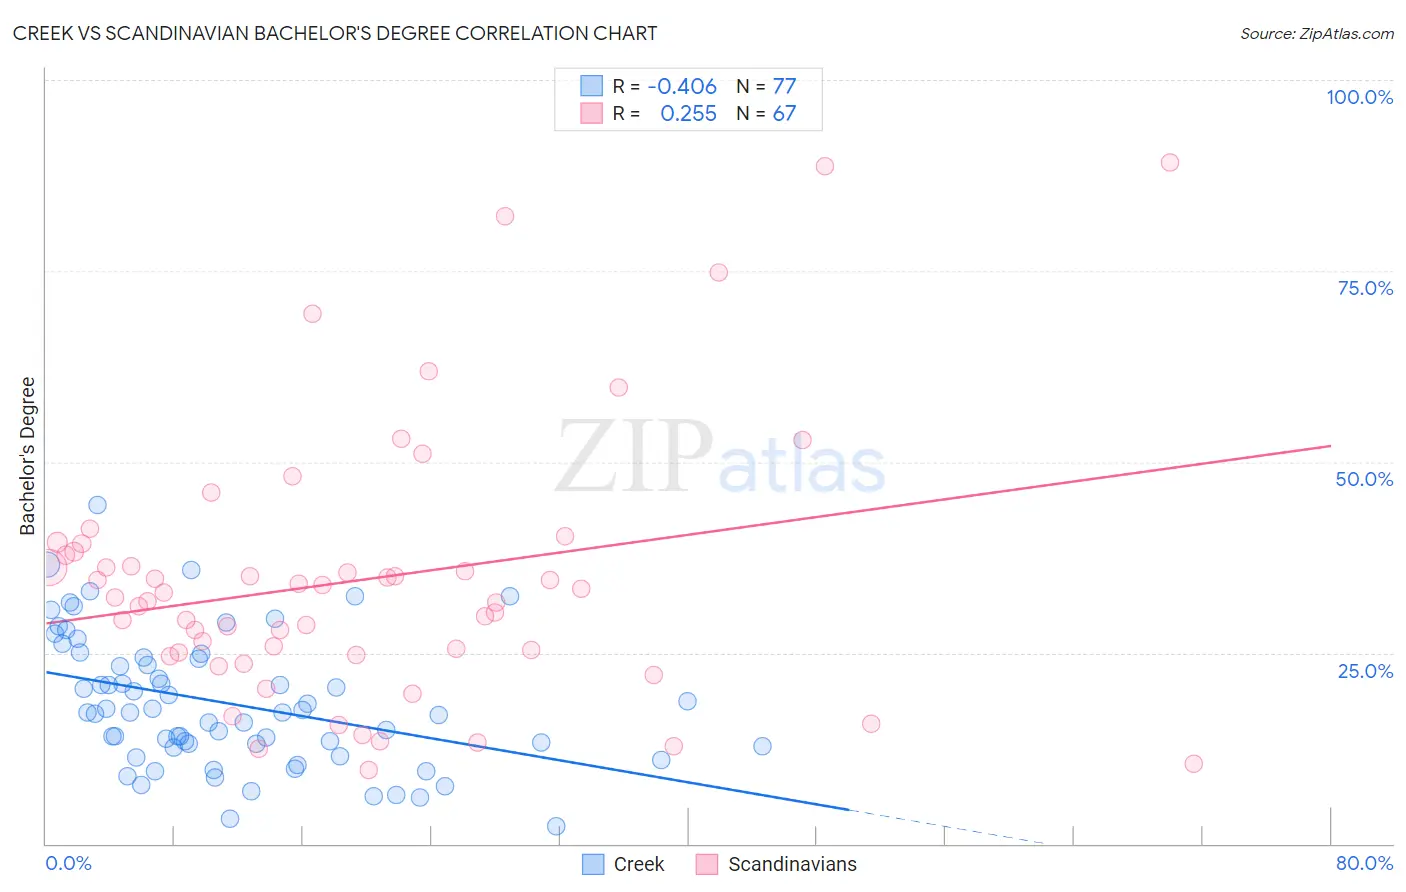
Creek vs Scandinavian Bachelor's Degree Correlation Chart
The statistical analysis conducted on geographies consisting of 178,478,956 people shows a moderate negative correlation between the proportion of Creek and percentage of population with at least bachelor's degree education in the United States with a correlation coefficient (R) of -0.406 and weighted average of 28.9%. Similarly, the statistical analysis conducted on geographies consisting of 472,607,707 people shows a weak positive correlation between the proportion of Scandinavians and percentage of population with at least bachelor's degree education in the United States with a correlation coefficient (R) of 0.255 and weighted average of 37.5%, a difference of 30.0%.
Bachelor's Degree Correlation Summary
| Measurement | Creek | Scandinavian |
| Minimum | 2.3% | 9.7% |
| Maximum | 44.3% | 89.2% |
| Range | 42.0% | 79.4% |
| Mean | 18.4% | 34.6% |
| Median | 17.1% | 32.2% |
| Interquartile 25% (IQ1) | 12.7% | 24.7% |
| Interquartile 75% (IQ3) | 24.3% | 38.3% |
| Interquartile Range (IQR) | 11.6% | 13.5% |
| Standard Deviation (Sample) | 8.6% | 17.4% |
| Standard Deviation (Population) | 8.6% | 17.3% |
Similar Demographics by Bachelor's Degree
Demographics Similar to Creek by Bachelor's Degree
In terms of bachelor's degree, the demographic groups most similar to Creek are Kiowa (28.8%, a difference of 0.040%), Alaskan Athabascan (28.8%, a difference of 0.13%), Tsimshian (28.8%, a difference of 0.35%), Yaqui (29.0%, a difference of 0.45%), and Fijian (28.7%, a difference of 0.48%).
| Demographics | Rating | Rank | Bachelor's Degree |
| Seminole | 0.0 /100 | #312 | Tragic 29.4% |
| Alaska Natives | 0.0 /100 | #313 | Tragic 29.4% |
| Shoshone | 0.0 /100 | #314 | Tragic 29.3% |
| Immigrants | Cabo Verde | 0.0 /100 | #315 | Tragic 29.2% |
| Sioux | 0.0 /100 | #316 | Tragic 29.1% |
| Colville | 0.0 /100 | #317 | Tragic 29.0% |
| Yaqui | 0.0 /100 | #318 | Tragic 29.0% |
| Creek | 0.0 /100 | #319 | Tragic 28.9% |
| Kiowa | 0.0 /100 | #320 | Tragic 28.8% |
| Alaskan Athabascans | 0.0 /100 | #321 | Tragic 28.8% |
| Tsimshian | 0.0 /100 | #322 | Tragic 28.8% |
| Fijians | 0.0 /100 | #323 | Tragic 28.7% |
| Dutch West Indians | 0.0 /100 | #324 | Tragic 28.5% |
| Pennsylvania Germans | 0.0 /100 | #325 | Tragic 28.4% |
| Apache | 0.0 /100 | #326 | Tragic 28.3% |
Demographics Similar to Scandinavians by Bachelor's Degree
In terms of bachelor's degree, the demographic groups most similar to Scandinavians are Senegalese (37.5%, a difference of 0.040%), Immigrants from Peru (37.5%, a difference of 0.040%), Norwegian (37.5%, a difference of 0.14%), Immigrants from Bosnia and Herzegovina (37.6%, a difference of 0.17%), and Immigrants from Senegal (37.6%, a difference of 0.20%).
| Demographics | Rating | Rank | Bachelor's Degree |
| Basques | 47.4 /100 | #177 | Average 37.7% |
| Immigrants | Cameroon | 46.8 /100 | #178 | Average 37.7% |
| Immigrants | Colombia | 45.4 /100 | #179 | Average 37.7% |
| Irish | 44.3 /100 | #180 | Average 37.6% |
| Immigrants | Senegal | 43.8 /100 | #181 | Average 37.6% |
| Immigrants | Bosnia and Herzegovina | 43.4 /100 | #182 | Average 37.6% |
| Senegalese | 42.2 /100 | #183 | Average 37.5% |
| Scandinavians | 41.7 /100 | #184 | Average 37.5% |
| Immigrants | Peru | 41.3 /100 | #185 | Average 37.5% |
| Norwegians | 40.4 /100 | #186 | Average 37.5% |
| English | 39.7 /100 | #187 | Fair 37.4% |
| Immigrants | Oceania | 37.3 /100 | #188 | Fair 37.3% |
| Slovaks | 36.9 /100 | #189 | Fair 37.3% |
| Swiss | 34.1 /100 | #190 | Fair 37.2% |
| Nigerians | 33.9 /100 | #191 | Fair 37.2% |