Uruguayan vs Scandinavian Bachelor's Degree
COMPARE
Uruguayan
Scandinavian
Bachelor's Degree
Bachelor's Degree Comparison
Uruguayans
Scandinavians
38.4%
BACHELOR'S DEGREE
65.8/ 100
METRIC RATING
161st/ 347
METRIC RANK
37.5%
BACHELOR'S DEGREE
41.7/ 100
METRIC RATING
184th/ 347
METRIC RANK
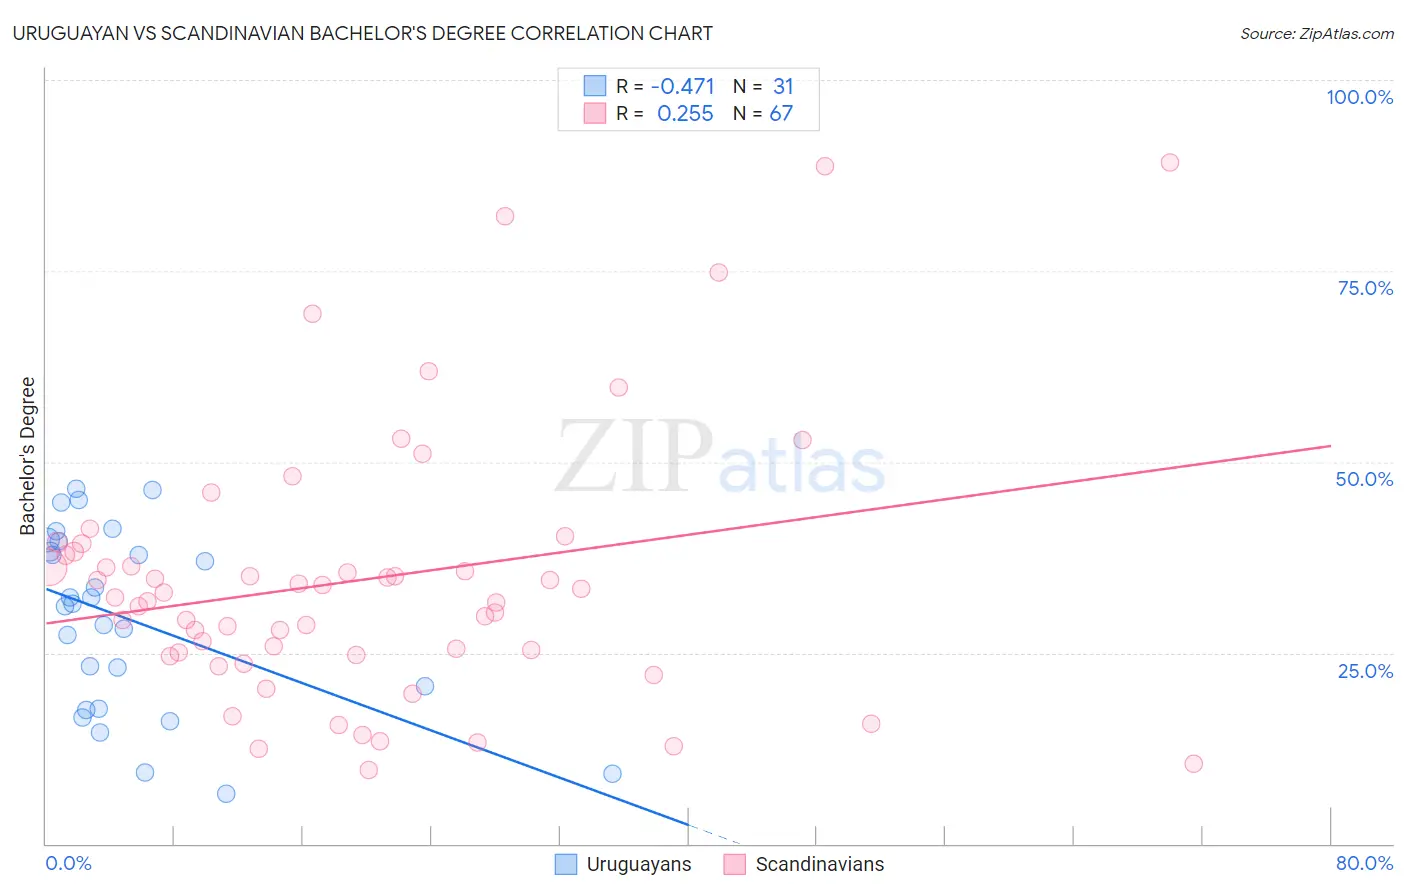
Uruguayan vs Scandinavian Bachelor's Degree Correlation Chart
The statistical analysis conducted on geographies consisting of 144,782,470 people shows a moderate negative correlation between the proportion of Uruguayans and percentage of population with at least bachelor's degree education in the United States with a correlation coefficient (R) of -0.471 and weighted average of 38.4%. Similarly, the statistical analysis conducted on geographies consisting of 472,607,707 people shows a weak positive correlation between the proportion of Scandinavians and percentage of population with at least bachelor's degree education in the United States with a correlation coefficient (R) of 0.255 and weighted average of 37.5%, a difference of 2.4%.
Bachelor's Degree Correlation Summary
| Measurement | Uruguayan | Scandinavian |
| Minimum | 6.5% | 9.7% |
| Maximum | 46.6% | 89.2% |
| Range | 40.1% | 79.4% |
| Mean | 29.5% | 34.6% |
| Median | 31.5% | 32.2% |
| Interquartile 25% (IQ1) | 17.7% | 24.7% |
| Interquartile 75% (IQ3) | 39.6% | 38.3% |
| Interquartile Range (IQR) | 21.9% | 13.5% |
| Standard Deviation (Sample) | 11.8% | 17.4% |
| Standard Deviation (Population) | 11.6% | 17.3% |
Similar Demographics by Bachelor's Degree
Demographics Similar to Uruguayans by Bachelor's Degree
In terms of bachelor's degree, the demographic groups most similar to Uruguayans are Vietnamese (38.5%, a difference of 0.080%), Colombian (38.4%, a difference of 0.080%), Chinese (38.5%, a difference of 0.090%), Peruvian (38.3%, a difference of 0.25%), and Hungarian (38.3%, a difference of 0.38%).
| Demographics | Rating | Rank | Bachelor's Degree |
| Canadians | 75.0 /100 | #154 | Good 38.8% |
| Immigrants | Kenya | 73.8 /100 | #155 | Good 38.8% |
| Kenyans | 72.5 /100 | #156 | Good 38.7% |
| Immigrants | South America | 70.1 /100 | #157 | Good 38.6% |
| Immigrants | Germany | 69.6 /100 | #158 | Good 38.6% |
| Chinese | 66.6 /100 | #159 | Good 38.5% |
| Vietnamese | 66.6 /100 | #160 | Good 38.5% |
| Uruguayans | 65.8 /100 | #161 | Good 38.4% |
| Colombians | 65.0 /100 | #162 | Good 38.4% |
| Peruvians | 63.4 /100 | #163 | Good 38.3% |
| Hungarians | 62.1 /100 | #164 | Good 38.3% |
| Sri Lankans | 59.1 /100 | #165 | Average 38.2% |
| Somalis | 58.6 /100 | #166 | Average 38.1% |
| Scottish | 56.6 /100 | #167 | Average 38.1% |
| Danes | 56.2 /100 | #168 | Average 38.1% |
Demographics Similar to Scandinavians by Bachelor's Degree
In terms of bachelor's degree, the demographic groups most similar to Scandinavians are Senegalese (37.5%, a difference of 0.040%), Immigrants from Peru (37.5%, a difference of 0.040%), Norwegian (37.5%, a difference of 0.14%), Immigrants from Bosnia and Herzegovina (37.6%, a difference of 0.17%), and Immigrants from Senegal (37.6%, a difference of 0.20%).
| Demographics | Rating | Rank | Bachelor's Degree |
| Basques | 47.4 /100 | #177 | Average 37.7% |
| Immigrants | Cameroon | 46.8 /100 | #178 | Average 37.7% |
| Immigrants | Colombia | 45.4 /100 | #179 | Average 37.7% |
| Irish | 44.3 /100 | #180 | Average 37.6% |
| Immigrants | Senegal | 43.8 /100 | #181 | Average 37.6% |
| Immigrants | Bosnia and Herzegovina | 43.4 /100 | #182 | Average 37.6% |
| Senegalese | 42.2 /100 | #183 | Average 37.5% |
| Scandinavians | 41.7 /100 | #184 | Average 37.5% |
| Immigrants | Peru | 41.3 /100 | #185 | Average 37.5% |
| Norwegians | 40.4 /100 | #186 | Average 37.5% |
| English | 39.7 /100 | #187 | Fair 37.4% |
| Immigrants | Oceania | 37.3 /100 | #188 | Fair 37.3% |
| Slovaks | 36.9 /100 | #189 | Fair 37.3% |
| Swiss | 34.1 /100 | #190 | Fair 37.2% |
| Nigerians | 33.9 /100 | #191 | Fair 37.2% |