Immigrants from Uruguay vs Immigrants from Asia 2nd Grade
COMPARE
Immigrants from Uruguay
Immigrants from Asia
2nd Grade
2nd Grade Comparison
Immigrants from Uruguay
Immigrants from Asia
97.6%
2ND GRADE
2.1/ 100
METRIC RATING
233rd/ 347
METRIC RANK
97.5%
2ND GRADE
0.7/ 100
METRIC RATING
252nd/ 347
METRIC RANK
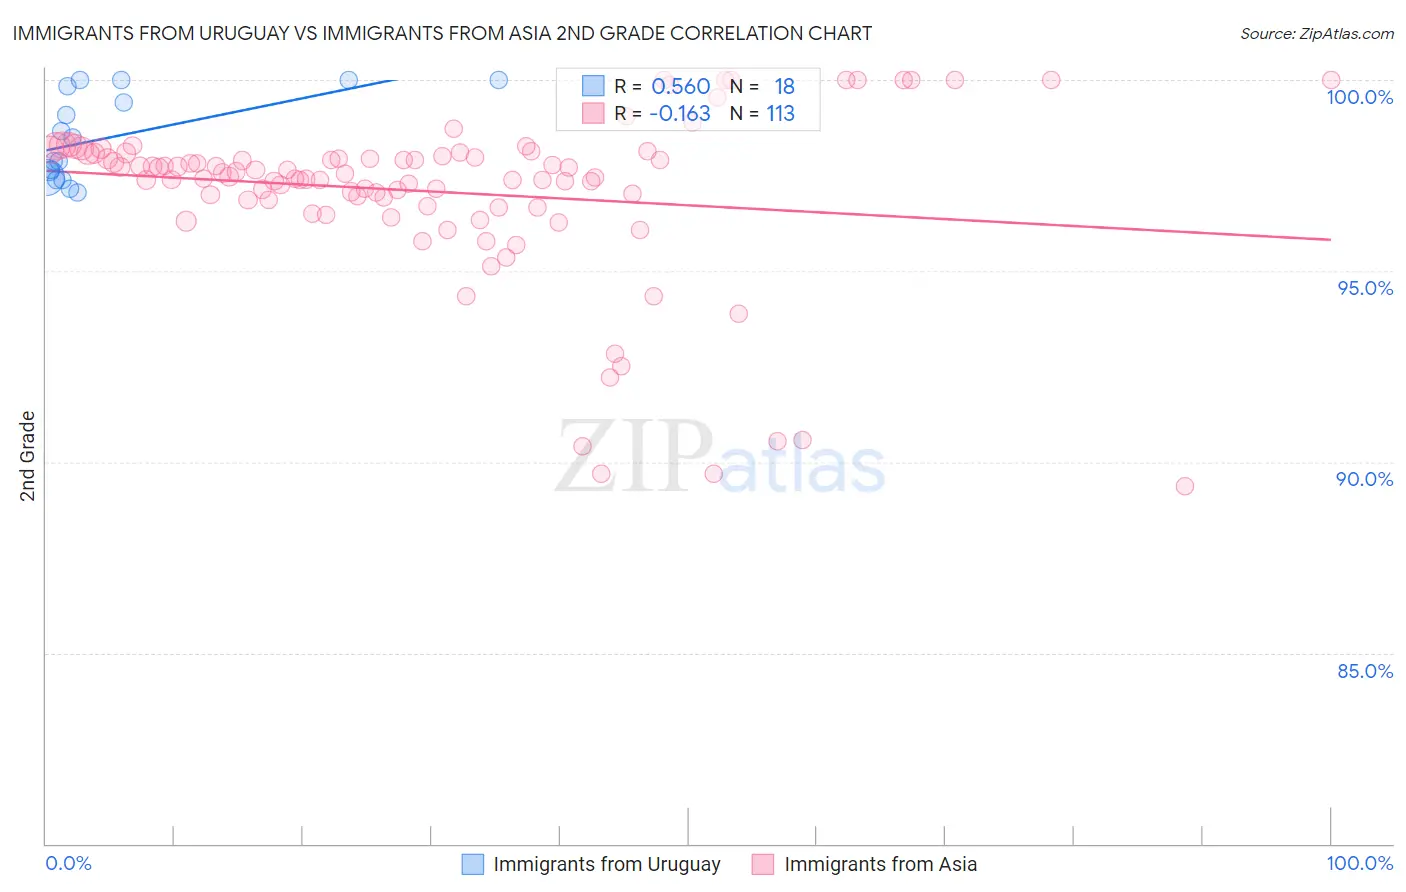
Immigrants from Uruguay vs Immigrants from Asia 2nd Grade Correlation Chart
The statistical analysis conducted on geographies consisting of 133,259,667 people shows a substantial positive correlation between the proportion of Immigrants from Uruguay and percentage of population with at least 2nd grade education in the United States with a correlation coefficient (R) of 0.560 and weighted average of 97.6%. Similarly, the statistical analysis conducted on geographies consisting of 549,170,546 people shows a poor negative correlation between the proportion of Immigrants from Asia and percentage of population with at least 2nd grade education in the United States with a correlation coefficient (R) of -0.163 and weighted average of 97.5%, a difference of 0.080%.
2nd Grade Correlation Summary
| Measurement | Immigrants from Uruguay | Immigrants from Asia |
| Minimum | 97.1% | 89.4% |
| Maximum | 100.0% | 100.0% |
| Range | 2.9% | 10.6% |
| Mean | 98.5% | 97.1% |
| Median | 98.2% | 97.5% |
| Interquartile 25% (IQ1) | 97.4% | 96.8% |
| Interquartile 75% (IQ3) | 99.8% | 98.1% |
| Interquartile Range (IQR) | 2.4% | 1.3% |
| Standard Deviation (Sample) | 1.1% | 2.2% |
| Standard Deviation (Population) | 1.1% | 2.2% |
Demographics Similar to Immigrants from Uruguay and Immigrants from Asia by 2nd Grade
In terms of 2nd grade, the demographic groups most similar to Immigrants from Uruguay are Immigrants from Western Asia (97.6%, a difference of 0.0%), Immigrants from Malaysia (97.6%, a difference of 0.0%), Colombian (97.6%, a difference of 0.010%), Nigerian (97.6%, a difference of 0.020%), and U.S. Virgin Islander (97.6%, a difference of 0.020%). Similarly, the demographic groups most similar to Immigrants from Asia are Peruvian (97.5%, a difference of 0.010%), Immigrants from Africa (97.5%, a difference of 0.010%), Immigrants from Eastern Africa (97.5%, a difference of 0.020%), South American (97.5%, a difference of 0.020%), and Immigrants from Senegal (97.5%, a difference of 0.020%).
| Demographics | Rating | Rank | 2nd Grade |
| Immigrants | Western Asia | 2.1 /100 | #232 | Tragic 97.6% |
| Immigrants | Uruguay | 2.1 /100 | #233 | Tragic 97.6% |
| Immigrants | Malaysia | 2.0 /100 | #234 | Tragic 97.6% |
| Colombians | 1.9 /100 | #235 | Tragic 97.6% |
| Nigerians | 1.7 /100 | #236 | Tragic 97.6% |
| U.S. Virgin Islanders | 1.6 /100 | #237 | Tragic 97.6% |
| Immigrants | Eastern Asia | 1.6 /100 | #238 | Tragic 97.6% |
| Liberians | 1.6 /100 | #239 | Tragic 97.6% |
| Koreans | 1.5 /100 | #240 | Tragic 97.5% |
| Ethiopians | 1.2 /100 | #241 | Tragic 97.5% |
| Immigrants | Indonesia | 1.2 /100 | #242 | Tragic 97.5% |
| Asians | 1.1 /100 | #243 | Tragic 97.5% |
| Immigrants | Iraq | 1.0 /100 | #244 | Tragic 97.5% |
| Immigrants | Eastern Africa | 0.9 /100 | #245 | Tragic 97.5% |
| South Americans | 0.9 /100 | #246 | Tragic 97.5% |
| Immigrants | Senegal | 0.9 /100 | #247 | Tragic 97.5% |
| Immigrants | Middle Africa | 0.9 /100 | #248 | Tragic 97.5% |
| Bolivians | 0.9 /100 | #249 | Tragic 97.5% |
| Peruvians | 0.9 /100 | #250 | Tragic 97.5% |
| Immigrants | Africa | 0.8 /100 | #251 | Tragic 97.5% |
| Immigrants | Asia | 0.7 /100 | #252 | Tragic 97.5% |