Indian (Asian) vs Moroccan 2nd Grade
COMPARE
Indian (Asian)
Moroccan
2nd Grade
2nd Grade Comparison
Indians (Asian)
Moroccans
97.5%
2ND GRADE
0.6/ 100
METRIC RATING
254th/ 347
METRIC RANK
97.7%
2ND GRADE
8.2/ 100
METRIC RATING
213th/ 347
METRIC RANK
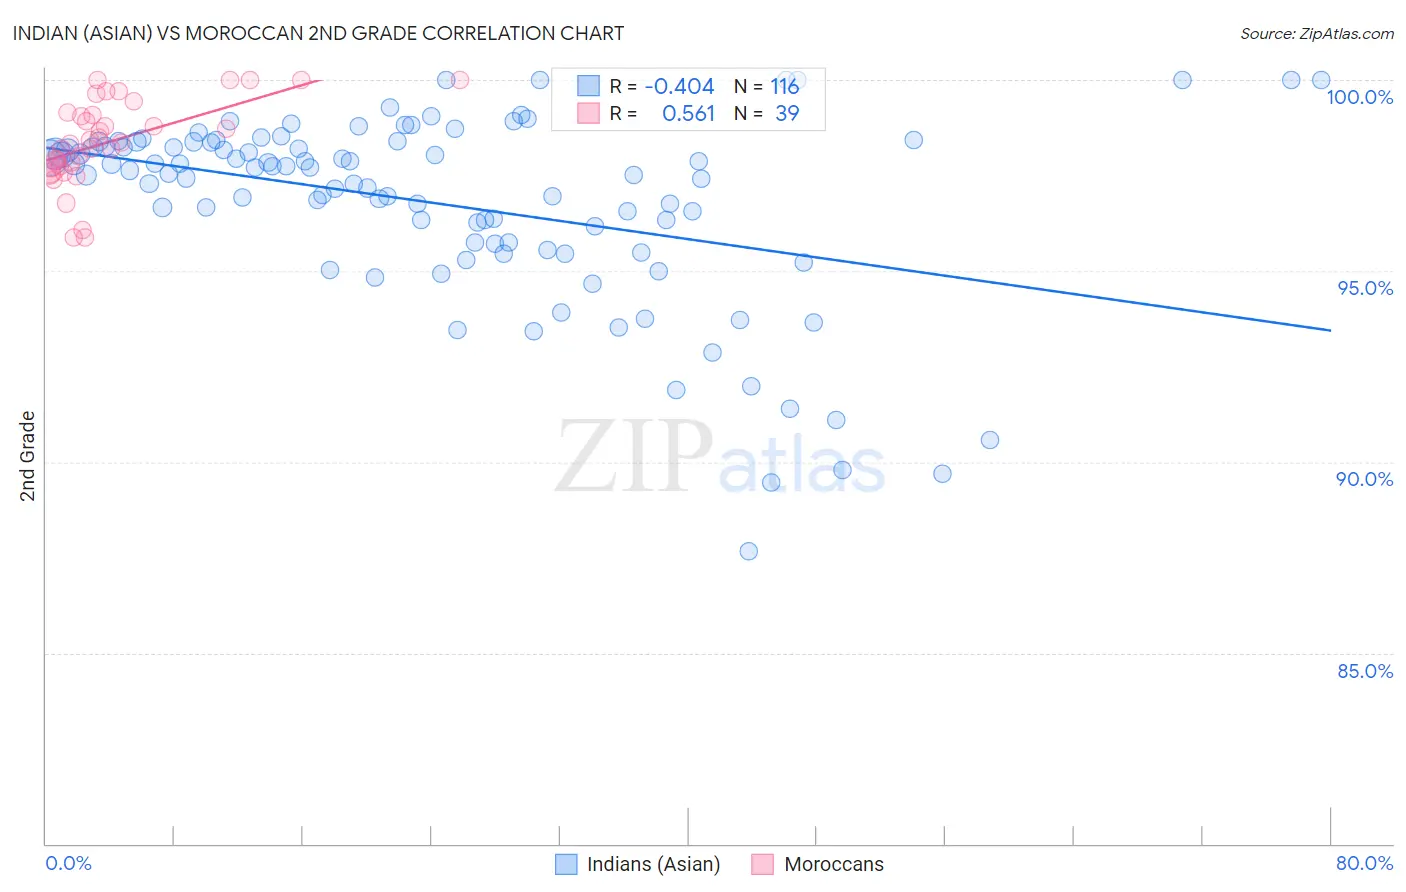
Indian (Asian) vs Moroccan 2nd Grade Correlation Chart
The statistical analysis conducted on geographies consisting of 495,287,818 people shows a moderate negative correlation between the proportion of Indians (Asian) and percentage of population with at least 2nd grade education in the United States with a correlation coefficient (R) of -0.404 and weighted average of 97.5%. Similarly, the statistical analysis conducted on geographies consisting of 201,817,667 people shows a substantial positive correlation between the proportion of Moroccans and percentage of population with at least 2nd grade education in the United States with a correlation coefficient (R) of 0.561 and weighted average of 97.7%, a difference of 0.21%.
2nd Grade Correlation Summary
| Measurement | Indian (Asian) | Moroccan |
| Minimum | 87.6% | 95.9% |
| Maximum | 100.0% | 100.0% |
| Range | 12.4% | 4.1% |
| Mean | 96.8% | 98.4% |
| Median | 97.6% | 98.3% |
| Interquartile 25% (IQ1) | 95.7% | 97.7% |
| Interquartile 75% (IQ3) | 98.4% | 99.1% |
| Interquartile Range (IQR) | 2.6% | 1.4% |
| Standard Deviation (Sample) | 2.5% | 1.1% |
| Standard Deviation (Population) | 2.5% | 1.1% |
Similar Demographics by 2nd Grade
Demographics Similar to Indians (Asian) by 2nd Grade
In terms of 2nd grade, the demographic groups most similar to Indians (Asian) are Immigrants from Congo (97.5%, a difference of 0.0%), Jamaican (97.5%, a difference of 0.0%), Immigrants from Asia (97.5%, a difference of 0.010%), Puerto Rican (97.5%, a difference of 0.010%), and Immigrants from Colombia (97.5%, a difference of 0.010%).
| Demographics | Rating | Rank | 2nd Grade |
| Immigrants | Senegal | 0.9 /100 | #247 | Tragic 97.5% |
| Immigrants | Middle Africa | 0.9 /100 | #248 | Tragic 97.5% |
| Bolivians | 0.9 /100 | #249 | Tragic 97.5% |
| Peruvians | 0.9 /100 | #250 | Tragic 97.5% |
| Immigrants | Africa | 0.8 /100 | #251 | Tragic 97.5% |
| Immigrants | Asia | 0.7 /100 | #252 | Tragic 97.5% |
| Puerto Ricans | 0.7 /100 | #253 | Tragic 97.5% |
| Indians (Asian) | 0.6 /100 | #254 | Tragic 97.5% |
| Immigrants | Congo | 0.6 /100 | #255 | Tragic 97.5% |
| Jamaicans | 0.6 /100 | #256 | Tragic 97.5% |
| Immigrants | Colombia | 0.5 /100 | #257 | Tragic 97.5% |
| Yaqui | 0.5 /100 | #258 | Tragic 97.5% |
| Fijians | 0.5 /100 | #259 | Tragic 97.5% |
| Assyrians/Chaldeans/Syriacs | 0.5 /100 | #260 | Tragic 97.5% |
| Armenians | 0.5 /100 | #261 | Tragic 97.5% |
Demographics Similar to Moroccans by 2nd Grade
In terms of 2nd grade, the demographic groups most similar to Moroccans are Immigrants from Bahamas (97.7%, a difference of 0.0%), Samoan (97.7%, a difference of 0.010%), Immigrants from Oceania (97.7%, a difference of 0.020%), Costa Rican (97.7%, a difference of 0.020%), and Laotian (97.7%, a difference of 0.020%).
| Demographics | Rating | Rank | 2nd Grade |
| Immigrants | Chile | 17.3 /100 | #206 | Poor 97.7% |
| Africans | 15.6 /100 | #207 | Poor 97.7% |
| Immigrants | Northern Africa | 12.3 /100 | #208 | Poor 97.7% |
| Immigrants | Oceania | 10.9 /100 | #209 | Poor 97.7% |
| Costa Ricans | 10.5 /100 | #210 | Poor 97.7% |
| Laotians | 9.9 /100 | #211 | Tragic 97.7% |
| Immigrants | Bahamas | 8.4 /100 | #212 | Tragic 97.7% |
| Moroccans | 8.2 /100 | #213 | Tragic 97.7% |
| Samoans | 7.1 /100 | #214 | Tragic 97.7% |
| Bahamians | 6.8 /100 | #215 | Tragic 97.7% |
| South American Indians | 6.7 /100 | #216 | Tragic 97.7% |
| Uruguayans | 6.2 /100 | #217 | Tragic 97.7% |
| Sudanese | 5.7 /100 | #218 | Tragic 97.7% |
| Immigrants | Panama | 5.1 /100 | #219 | Tragic 97.6% |
| Immigrants | Morocco | 5.0 /100 | #220 | Tragic 97.6% |