British West Indian vs Moroccan 2nd Grade
COMPARE
British West Indian
Moroccan
2nd Grade
2nd Grade Comparison
British West Indians
Moroccans
97.2%
2ND GRADE
0.0/ 100
METRIC RATING
293rd/ 347
METRIC RANK
97.7%
2ND GRADE
8.2/ 100
METRIC RATING
213th/ 347
METRIC RANK
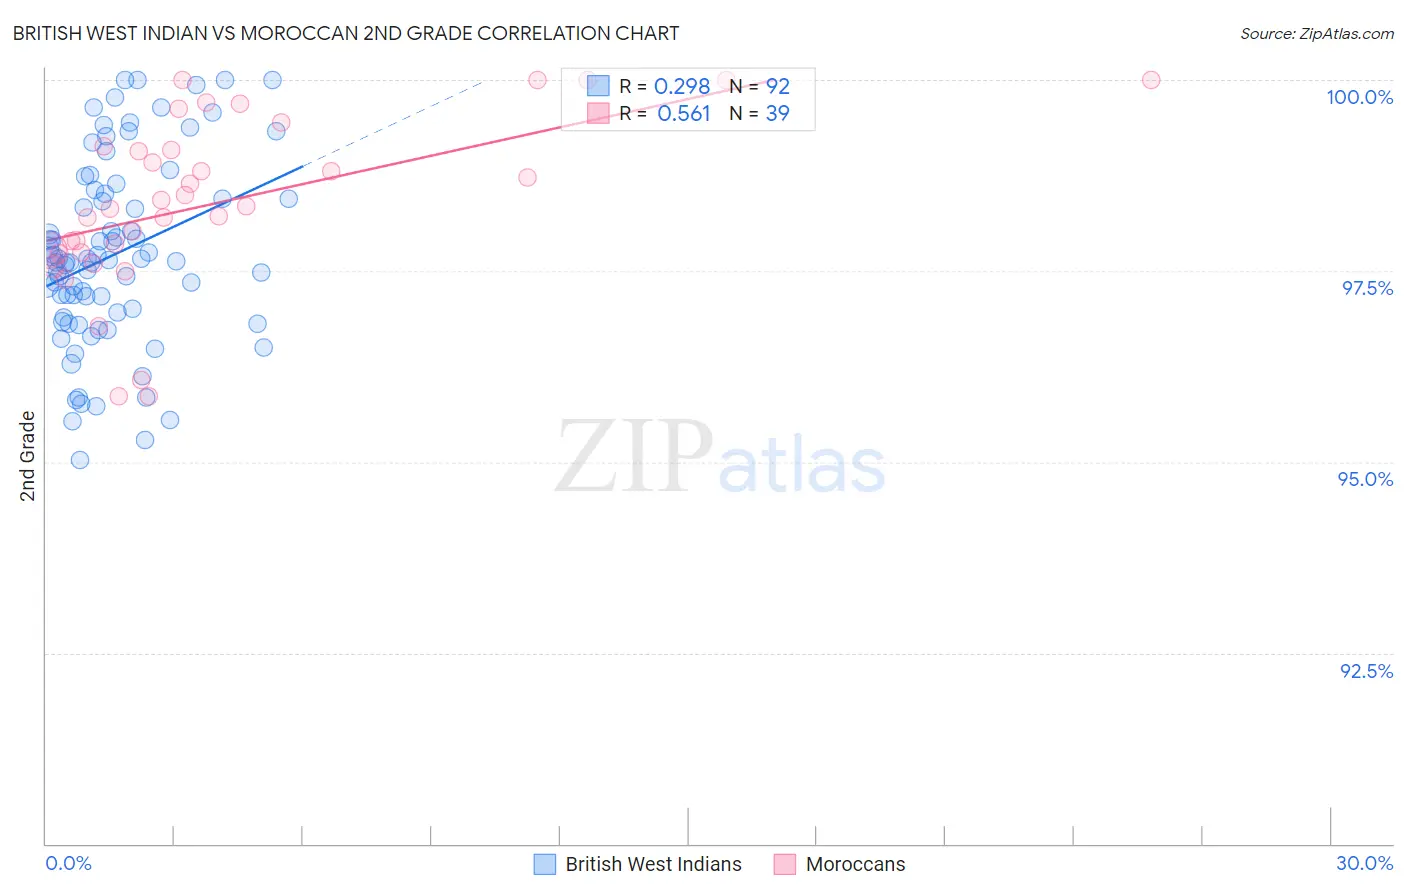
British West Indian vs Moroccan 2nd Grade Correlation Chart
The statistical analysis conducted on geographies consisting of 152,691,173 people shows a weak positive correlation between the proportion of British West Indians and percentage of population with at least 2nd grade education in the United States with a correlation coefficient (R) of 0.298 and weighted average of 97.2%. Similarly, the statistical analysis conducted on geographies consisting of 201,817,667 people shows a substantial positive correlation between the proportion of Moroccans and percentage of population with at least 2nd grade education in the United States with a correlation coefficient (R) of 0.561 and weighted average of 97.7%, a difference of 0.54%.
2nd Grade Correlation Summary
| Measurement | British West Indian | Moroccan |
| Minimum | 95.0% | 95.9% |
| Maximum | 100.0% | 100.0% |
| Range | 5.0% | 4.1% |
| Mean | 97.7% | 98.4% |
| Median | 97.6% | 98.3% |
| Interquartile 25% (IQ1) | 96.9% | 97.7% |
| Interquartile 75% (IQ3) | 98.5% | 99.1% |
| Interquartile Range (IQR) | 1.6% | 1.4% |
| Standard Deviation (Sample) | 1.2% | 1.1% |
| Standard Deviation (Population) | 1.2% | 1.1% |
Similar Demographics by 2nd Grade
Demographics Similar to British West Indians by 2nd Grade
In terms of 2nd grade, the demographic groups most similar to British West Indians are Immigrants from Eritrea (97.2%, a difference of 0.010%), Malaysian (97.1%, a difference of 0.020%), Houma (97.2%, a difference of 0.040%), Immigrants from St. Vincent and the Grenadines (97.2%, a difference of 0.040%), and Immigrants from Afghanistan (97.2%, a difference of 0.040%).
| Demographics | Rating | Rank | 2nd Grade |
| Immigrants | Barbados | 0.0 /100 | #286 | Tragic 97.2% |
| Immigrants | Portugal | 0.0 /100 | #287 | Tragic 97.2% |
| Immigrants | Thailand | 0.0 /100 | #288 | Tragic 97.2% |
| Houma | 0.0 /100 | #289 | Tragic 97.2% |
| Immigrants | St. Vincent and the Grenadines | 0.0 /100 | #290 | Tragic 97.2% |
| Immigrants | Afghanistan | 0.0 /100 | #291 | Tragic 97.2% |
| Immigrants | Eritrea | 0.0 /100 | #292 | Tragic 97.2% |
| British West Indians | 0.0 /100 | #293 | Tragic 97.2% |
| Malaysians | 0.0 /100 | #294 | Tragic 97.1% |
| Immigrants | Grenada | 0.0 /100 | #295 | Tragic 97.1% |
| Immigrants | Immigrants | 0.0 /100 | #296 | Tragic 97.1% |
| Immigrants | Cuba | 0.0 /100 | #297 | Tragic 97.0% |
| Immigrants | Dominica | 0.0 /100 | #298 | Tragic 97.0% |
| Haitians | 0.0 /100 | #299 | Tragic 97.0% |
| Immigrants | South Eastern Asia | 0.0 /100 | #300 | Tragic 97.0% |
Demographics Similar to Moroccans by 2nd Grade
In terms of 2nd grade, the demographic groups most similar to Moroccans are Immigrants from Bahamas (97.7%, a difference of 0.0%), Samoan (97.7%, a difference of 0.010%), Immigrants from Oceania (97.7%, a difference of 0.020%), Costa Rican (97.7%, a difference of 0.020%), and Laotian (97.7%, a difference of 0.020%).
| Demographics | Rating | Rank | 2nd Grade |
| Immigrants | Chile | 17.3 /100 | #206 | Poor 97.7% |
| Africans | 15.6 /100 | #207 | Poor 97.7% |
| Immigrants | Northern Africa | 12.3 /100 | #208 | Poor 97.7% |
| Immigrants | Oceania | 10.9 /100 | #209 | Poor 97.7% |
| Costa Ricans | 10.5 /100 | #210 | Poor 97.7% |
| Laotians | 9.9 /100 | #211 | Tragic 97.7% |
| Immigrants | Bahamas | 8.4 /100 | #212 | Tragic 97.7% |
| Moroccans | 8.2 /100 | #213 | Tragic 97.7% |
| Samoans | 7.1 /100 | #214 | Tragic 97.7% |
| Bahamians | 6.8 /100 | #215 | Tragic 97.7% |
| South American Indians | 6.7 /100 | #216 | Tragic 97.7% |
| Uruguayans | 6.2 /100 | #217 | Tragic 97.7% |
| Sudanese | 5.7 /100 | #218 | Tragic 97.7% |
| Immigrants | Panama | 5.1 /100 | #219 | Tragic 97.6% |
| Immigrants | Morocco | 5.0 /100 | #220 | Tragic 97.6% |