Immigrants from Uruguay vs Immigrants from Philippines 9th Grade
COMPARE
Immigrants from Uruguay
Immigrants from Philippines
9th Grade
9th Grade Comparison
Immigrants from Uruguay
Immigrants from Philippines
93.8%
9TH GRADE
0.2/ 100
METRIC RATING
269th/ 347
METRIC RANK
93.7%
9TH GRADE
0.1/ 100
METRIC RATING
277th/ 347
METRIC RANK
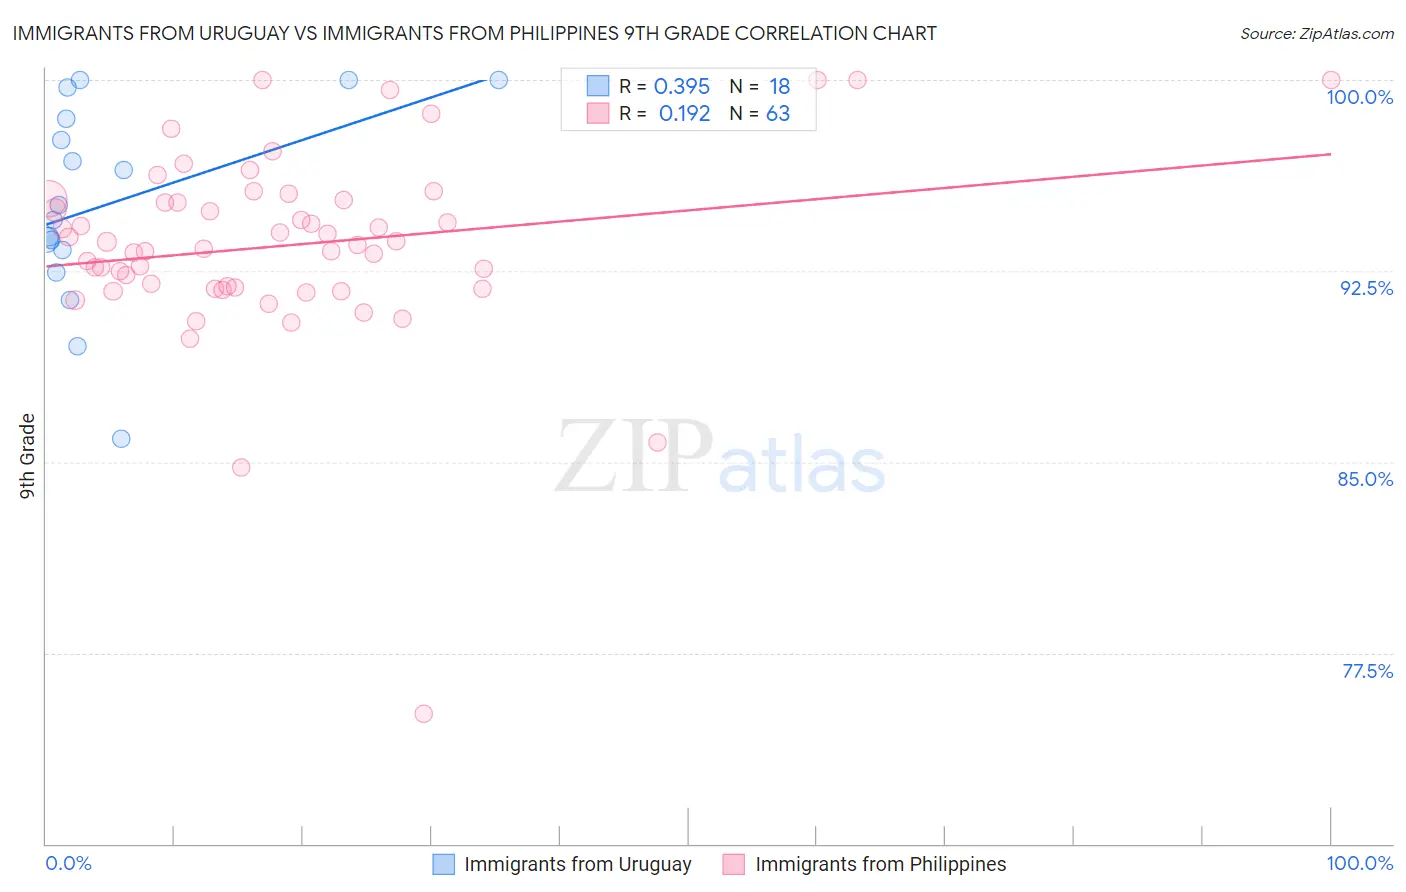
Immigrants from Uruguay vs Immigrants from Philippines 9th Grade Correlation Chart
The statistical analysis conducted on geographies consisting of 133,259,667 people shows a mild positive correlation between the proportion of Immigrants from Uruguay and percentage of population with at least 9th grade education in the United States with a correlation coefficient (R) of 0.395 and weighted average of 93.8%. Similarly, the statistical analysis conducted on geographies consisting of 471,300,535 people shows a poor positive correlation between the proportion of Immigrants from Philippines and percentage of population with at least 9th grade education in the United States with a correlation coefficient (R) of 0.192 and weighted average of 93.7%, a difference of 0.090%.
9th Grade Correlation Summary
| Measurement | Immigrants from Uruguay | Immigrants from Philippines |
| Minimum | 85.9% | 75.1% |
| Maximum | 100.0% | 100.0% |
| Range | 14.1% | 24.9% |
| Mean | 95.1% | 93.5% |
| Median | 94.8% | 93.5% |
| Interquartile 25% (IQ1) | 93.3% | 91.8% |
| Interquartile 75% (IQ3) | 98.5% | 95.3% |
| Interquartile Range (IQR) | 5.2% | 3.5% |
| Standard Deviation (Sample) | 3.9% | 3.8% |
| Standard Deviation (Population) | 3.8% | 3.8% |
Demographics Similar to Immigrants from Uruguay and Immigrants from Philippines by 9th Grade
In terms of 9th grade, the demographic groups most similar to Immigrants from Uruguay are Yuman (93.8%, a difference of 0.010%), Immigrants from Ghana (93.8%, a difference of 0.030%), Immigrants from Bolivia (93.9%, a difference of 0.040%), Immigrants from Western Africa (93.8%, a difference of 0.040%), and Immigrants from South America (93.8%, a difference of 0.050%). Similarly, the demographic groups most similar to Immigrants from Philippines are Immigrants from Eritrea (93.7%, a difference of 0.0%), West Indian (93.7%, a difference of 0.010%), Immigrants from Colombia (93.8%, a difference of 0.020%), Immigrants from South America (93.8%, a difference of 0.030%), and Peruvian (93.8%, a difference of 0.030%).
| Demographics | Rating | Rank | 9th Grade |
| Immigrants | Uzbekistan | 0.4 /100 | #263 | Tragic 93.9% |
| Immigrants | Congo | 0.4 /100 | #264 | Tragic 93.9% |
| Natives/Alaskans | 0.4 /100 | #265 | Tragic 93.9% |
| Navajo | 0.3 /100 | #266 | Tragic 93.9% |
| Armenians | 0.3 /100 | #267 | Tragic 93.9% |
| Immigrants | Bolivia | 0.3 /100 | #268 | Tragic 93.9% |
| Immigrants | Uruguay | 0.2 /100 | #269 | Tragic 93.8% |
| Yuman | 0.2 /100 | #270 | Tragic 93.8% |
| Immigrants | Ghana | 0.2 /100 | #271 | Tragic 93.8% |
| Immigrants | Western Africa | 0.2 /100 | #272 | Tragic 93.8% |
| Immigrants | South America | 0.2 /100 | #273 | Tragic 93.8% |
| Peruvians | 0.2 /100 | #274 | Tragic 93.8% |
| Immigrants | Colombia | 0.2 /100 | #275 | Tragic 93.8% |
| West Indians | 0.2 /100 | #276 | Tragic 93.7% |
| Immigrants | Philippines | 0.1 /100 | #277 | Tragic 93.7% |
| Immigrants | Eritrea | 0.1 /100 | #278 | Tragic 93.7% |
| Trinidadians and Tobagonians | 0.1 /100 | #279 | Tragic 93.7% |
| Taiwanese | 0.1 /100 | #280 | Tragic 93.6% |
| Immigrants | Trinidad and Tobago | 0.1 /100 | #281 | Tragic 93.6% |
| Malaysians | 0.0 /100 | #282 | Tragic 93.5% |
| Barbadians | 0.0 /100 | #283 | Tragic 93.5% |