Immigrants from Uruguay vs Carpatho Rusyn 9th Grade
COMPARE
Immigrants from Uruguay
Carpatho Rusyn
9th Grade
9th Grade Comparison
Immigrants from Uruguay
Carpatho Rusyns
93.8%
9TH GRADE
0.2/ 100
METRIC RATING
269th/ 347
METRIC RANK
96.7%
9TH GRADE
100.0/ 100
METRIC RATING
7th/ 347
METRIC RANK
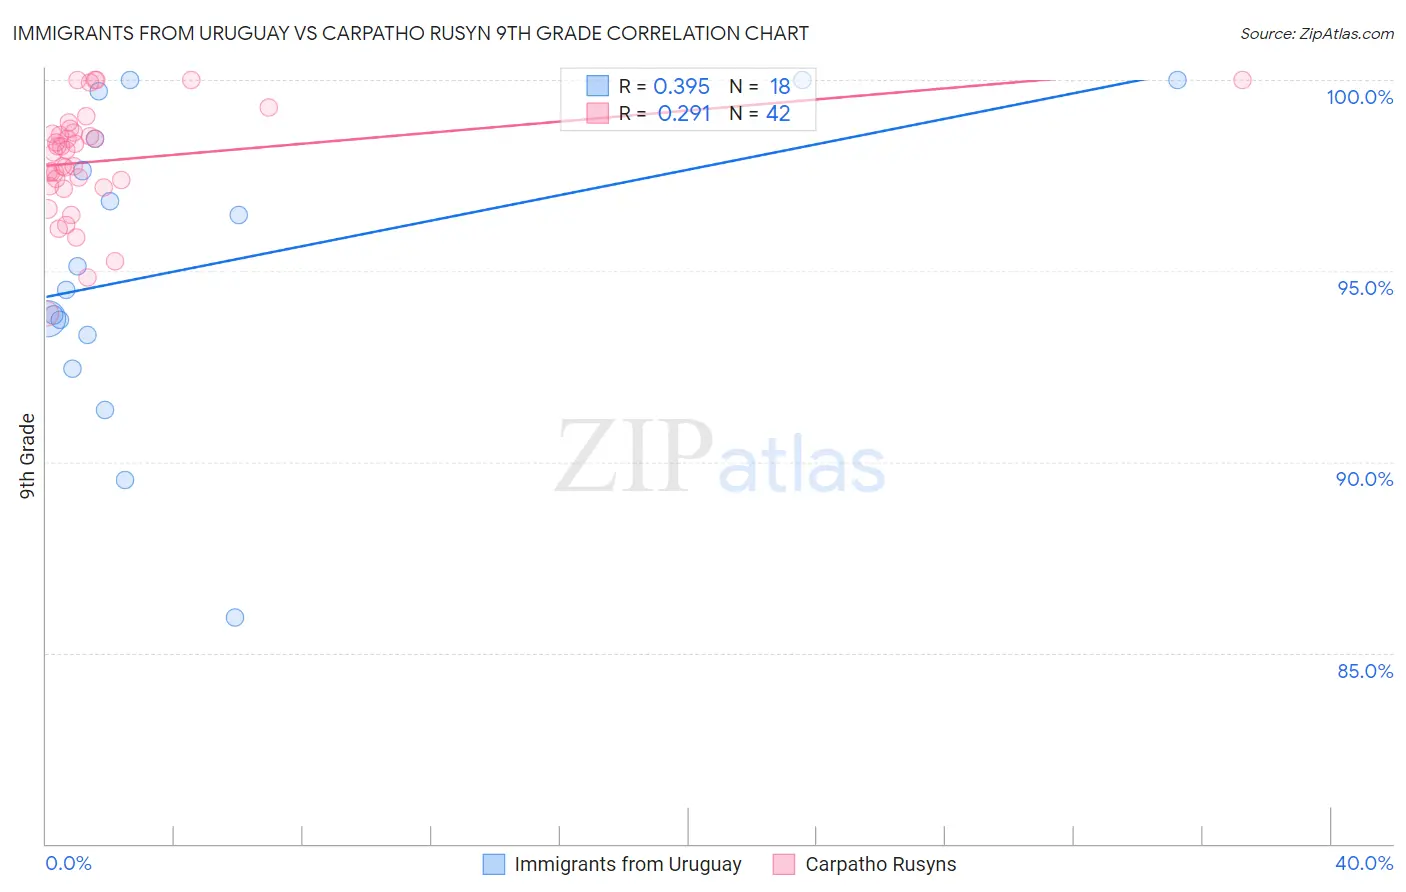
Immigrants from Uruguay vs Carpatho Rusyn 9th Grade Correlation Chart
The statistical analysis conducted on geographies consisting of 133,259,667 people shows a mild positive correlation between the proportion of Immigrants from Uruguay and percentage of population with at least 9th grade education in the United States with a correlation coefficient (R) of 0.395 and weighted average of 93.8%. Similarly, the statistical analysis conducted on geographies consisting of 58,871,690 people shows a weak positive correlation between the proportion of Carpatho Rusyns and percentage of population with at least 9th grade education in the United States with a correlation coefficient (R) of 0.291 and weighted average of 96.7%, a difference of 3.1%.
9th Grade Correlation Summary
| Measurement | Immigrants from Uruguay | Carpatho Rusyn |
| Minimum | 85.9% | 93.9% |
| Maximum | 100.0% | 100.0% |
| Range | 14.1% | 6.1% |
| Mean | 95.1% | 97.9% |
| Median | 94.8% | 98.1% |
| Interquartile 25% (IQ1) | 93.3% | 97.2% |
| Interquartile 75% (IQ3) | 98.5% | 98.6% |
| Interquartile Range (IQR) | 5.2% | 1.4% |
| Standard Deviation (Sample) | 3.9% | 1.4% |
| Standard Deviation (Population) | 3.8% | 1.4% |
Similar Demographics by 9th Grade
Demographics Similar to Immigrants from Uruguay by 9th Grade
In terms of 9th grade, the demographic groups most similar to Immigrants from Uruguay are Yuman (93.8%, a difference of 0.010%), Immigrants from Ghana (93.8%, a difference of 0.030%), Immigrants from Bolivia (93.9%, a difference of 0.040%), Immigrants from Western Africa (93.8%, a difference of 0.040%), and Immigrants from South America (93.8%, a difference of 0.050%).
| Demographics | Rating | Rank | 9th Grade |
| Immigrants | Jamaica | 0.4 /100 | #262 | Tragic 93.9% |
| Immigrants | Uzbekistan | 0.4 /100 | #263 | Tragic 93.9% |
| Immigrants | Congo | 0.4 /100 | #264 | Tragic 93.9% |
| Natives/Alaskans | 0.4 /100 | #265 | Tragic 93.9% |
| Navajo | 0.3 /100 | #266 | Tragic 93.9% |
| Armenians | 0.3 /100 | #267 | Tragic 93.9% |
| Immigrants | Bolivia | 0.3 /100 | #268 | Tragic 93.9% |
| Immigrants | Uruguay | 0.2 /100 | #269 | Tragic 93.8% |
| Yuman | 0.2 /100 | #270 | Tragic 93.8% |
| Immigrants | Ghana | 0.2 /100 | #271 | Tragic 93.8% |
| Immigrants | Western Africa | 0.2 /100 | #272 | Tragic 93.8% |
| Immigrants | South America | 0.2 /100 | #273 | Tragic 93.8% |
| Peruvians | 0.2 /100 | #274 | Tragic 93.8% |
| Immigrants | Colombia | 0.2 /100 | #275 | Tragic 93.8% |
| West Indians | 0.2 /100 | #276 | Tragic 93.7% |
Demographics Similar to Carpatho Rusyns by 9th Grade
In terms of 9th grade, the demographic groups most similar to Carpatho Rusyns are Swedish (96.7%, a difference of 0.010%), Polish (96.7%, a difference of 0.010%), German (96.7%, a difference of 0.010%), Slovene (96.7%, a difference of 0.020%), and Tlingit-Haida (96.6%, a difference of 0.090%).
| Demographics | Rating | Rank | 9th Grade |
| Tsimshian | 100.0 /100 | #1 | Exceptional 97.0% |
| Norwegians | 100.0 /100 | #2 | Exceptional 96.9% |
| Slovaks | 100.0 /100 | #3 | Exceptional 96.9% |
| Slovenes | 100.0 /100 | #4 | Exceptional 96.7% |
| Swedes | 100.0 /100 | #5 | Exceptional 96.7% |
| Poles | 100.0 /100 | #6 | Exceptional 96.7% |
| Carpatho Rusyns | 100.0 /100 | #7 | Exceptional 96.7% |
| Germans | 100.0 /100 | #8 | Exceptional 96.7% |
| Tlingit-Haida | 100.0 /100 | #9 | Exceptional 96.6% |
| Lithuanians | 100.0 /100 | #10 | Exceptional 96.6% |
| Finns | 100.0 /100 | #11 | Exceptional 96.6% |
| English | 100.0 /100 | #12 | Exceptional 96.6% |
| Danes | 100.0 /100 | #13 | Exceptional 96.5% |
| Scottish | 100.0 /100 | #14 | Exceptional 96.5% |
| Irish | 100.0 /100 | #15 | Exceptional 96.5% |