Immigrants from Netherlands vs Hawaiian Bachelor's Degree
COMPARE
Immigrants from Netherlands
Hawaiian
Bachelor's Degree
Bachelor's Degree Comparison
Immigrants from Netherlands
Hawaiians
43.3%
BACHELOR'S DEGREE
99.7/ 100
METRIC RATING
66th/ 347
METRIC RANK
31.6%
BACHELOR'S DEGREE
0.1/ 100
METRIC RATING
279th/ 347
METRIC RANK
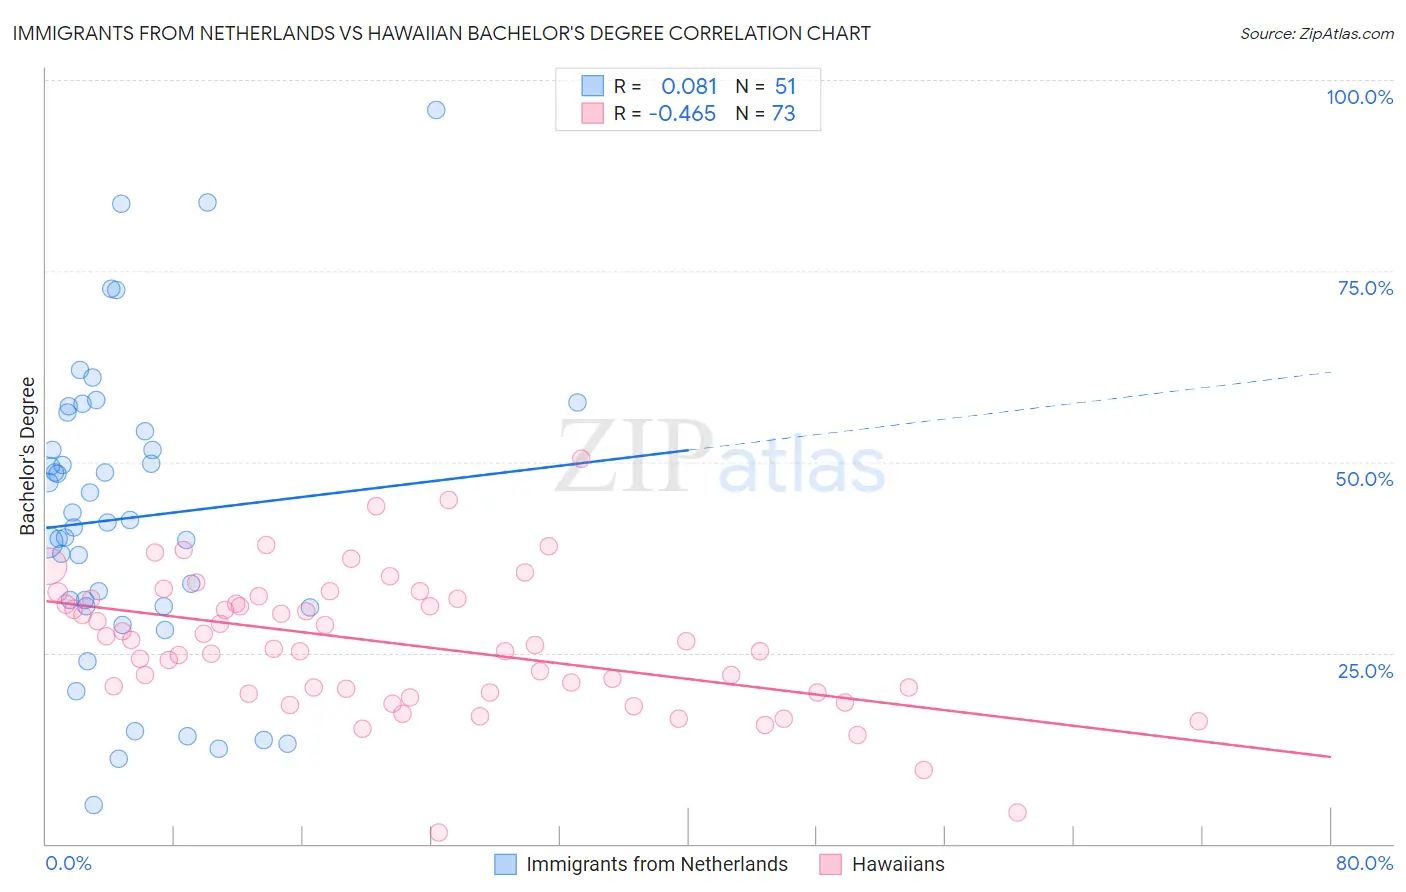
Immigrants from Netherlands vs Hawaiian Bachelor's Degree Correlation Chart
The statistical analysis conducted on geographies consisting of 237,874,454 people shows a slight positive correlation between the proportion of Immigrants from Netherlands and percentage of population with at least bachelor's degree education in the United States with a correlation coefficient (R) of 0.081 and weighted average of 43.3%. Similarly, the statistical analysis conducted on geographies consisting of 327,580,632 people shows a moderate negative correlation between the proportion of Hawaiians and percentage of population with at least bachelor's degree education in the United States with a correlation coefficient (R) of -0.465 and weighted average of 31.6%, a difference of 36.8%.
Bachelor's Degree Correlation Summary
| Measurement | Immigrants from Netherlands | Hawaiian |
| Minimum | 5.0% | 1.4% |
| Maximum | 96.1% | 50.4% |
| Range | 91.1% | 49.0% |
| Mean | 42.7% | 26.2% |
| Median | 42.1% | 26.0% |
| Interquartile 25% (IQ1) | 31.0% | 19.8% |
| Interquartile 75% (IQ3) | 54.0% | 32.1% |
| Interquartile Range (IQR) | 23.0% | 12.3% |
| Standard Deviation (Sample) | 19.6% | 8.9% |
| Standard Deviation (Population) | 19.4% | 8.9% |
Similar Demographics by Bachelor's Degree
Demographics Similar to Immigrants from Netherlands by Bachelor's Degree
In terms of bachelor's degree, the demographic groups most similar to Immigrants from Netherlands are Argentinean (43.3%, a difference of 0.020%), Zimbabwean (43.3%, a difference of 0.020%), Egyptian (43.3%, a difference of 0.020%), Immigrants from Indonesia (43.3%, a difference of 0.040%), and Immigrants from Europe (43.4%, a difference of 0.30%).
| Demographics | Rating | Rank | Bachelor's Degree |
| Australians | 99.9 /100 | #59 | Exceptional 44.0% |
| New Zealanders | 99.9 /100 | #60 | Exceptional 44.0% |
| South Africans | 99.8 /100 | #61 | Exceptional 43.6% |
| Immigrants | Kazakhstan | 99.8 /100 | #62 | Exceptional 43.4% |
| Immigrants | Europe | 99.8 /100 | #63 | Exceptional 43.4% |
| Argentineans | 99.7 /100 | #64 | Exceptional 43.3% |
| Zimbabweans | 99.7 /100 | #65 | Exceptional 43.3% |
| Immigrants | Netherlands | 99.7 /100 | #66 | Exceptional 43.3% |
| Egyptians | 99.7 /100 | #67 | Exceptional 43.3% |
| Immigrants | Indonesia | 99.7 /100 | #68 | Exceptional 43.3% |
| Immigrants | Pakistan | 99.7 /100 | #69 | Exceptional 43.1% |
| Immigrants | Romania | 99.6 /100 | #70 | Exceptional 42.9% |
| Immigrants | Argentina | 99.6 /100 | #71 | Exceptional 42.8% |
| Ethiopians | 99.5 /100 | #72 | Exceptional 42.8% |
| Immigrants | Uzbekistan | 99.5 /100 | #73 | Exceptional 42.8% |
Demographics Similar to Hawaiians by Bachelor's Degree
In terms of bachelor's degree, the demographic groups most similar to Hawaiians are Immigrants from Laos (31.6%, a difference of 0.050%), Marshallese (31.7%, a difference of 0.35%), Dominican (31.8%, a difference of 0.40%), Blackfeet (31.5%, a difference of 0.51%), and Salvadoran (31.8%, a difference of 0.55%).
| Demographics | Rating | Rank | Bachelor's Degree |
| Comanche | 0.2 /100 | #272 | Tragic 31.9% |
| Americans | 0.2 /100 | #273 | Tragic 31.9% |
| Potawatomi | 0.2 /100 | #274 | Tragic 31.9% |
| Samoans | 0.1 /100 | #275 | Tragic 31.8% |
| Salvadorans | 0.1 /100 | #276 | Tragic 31.8% |
| Dominicans | 0.1 /100 | #277 | Tragic 31.8% |
| Marshallese | 0.1 /100 | #278 | Tragic 31.7% |
| Hawaiians | 0.1 /100 | #279 | Tragic 31.6% |
| Immigrants | Laos | 0.1 /100 | #280 | Tragic 31.6% |
| Blackfeet | 0.1 /100 | #281 | Tragic 31.5% |
| Immigrants | Caribbean | 0.1 /100 | #282 | Tragic 31.4% |
| Hondurans | 0.1 /100 | #283 | Tragic 31.3% |
| Haitians | 0.1 /100 | #284 | Tragic 31.3% |
| Aleuts | 0.1 /100 | #285 | Tragic 31.3% |
| Immigrants | El Salvador | 0.1 /100 | #286 | Tragic 31.3% |