Immigrants from Uruguay vs Carpatho Rusyn 5th Grade
COMPARE
Immigrants from Uruguay
Carpatho Rusyn
5th Grade
5th Grade Comparison
Immigrants from Uruguay
Carpatho Rusyns
96.9%
5TH GRADE
1.0/ 100
METRIC RATING
249th/ 347
METRIC RANK
98.3%
5TH GRADE
100.0/ 100
METRIC RATING
12th/ 347
METRIC RANK
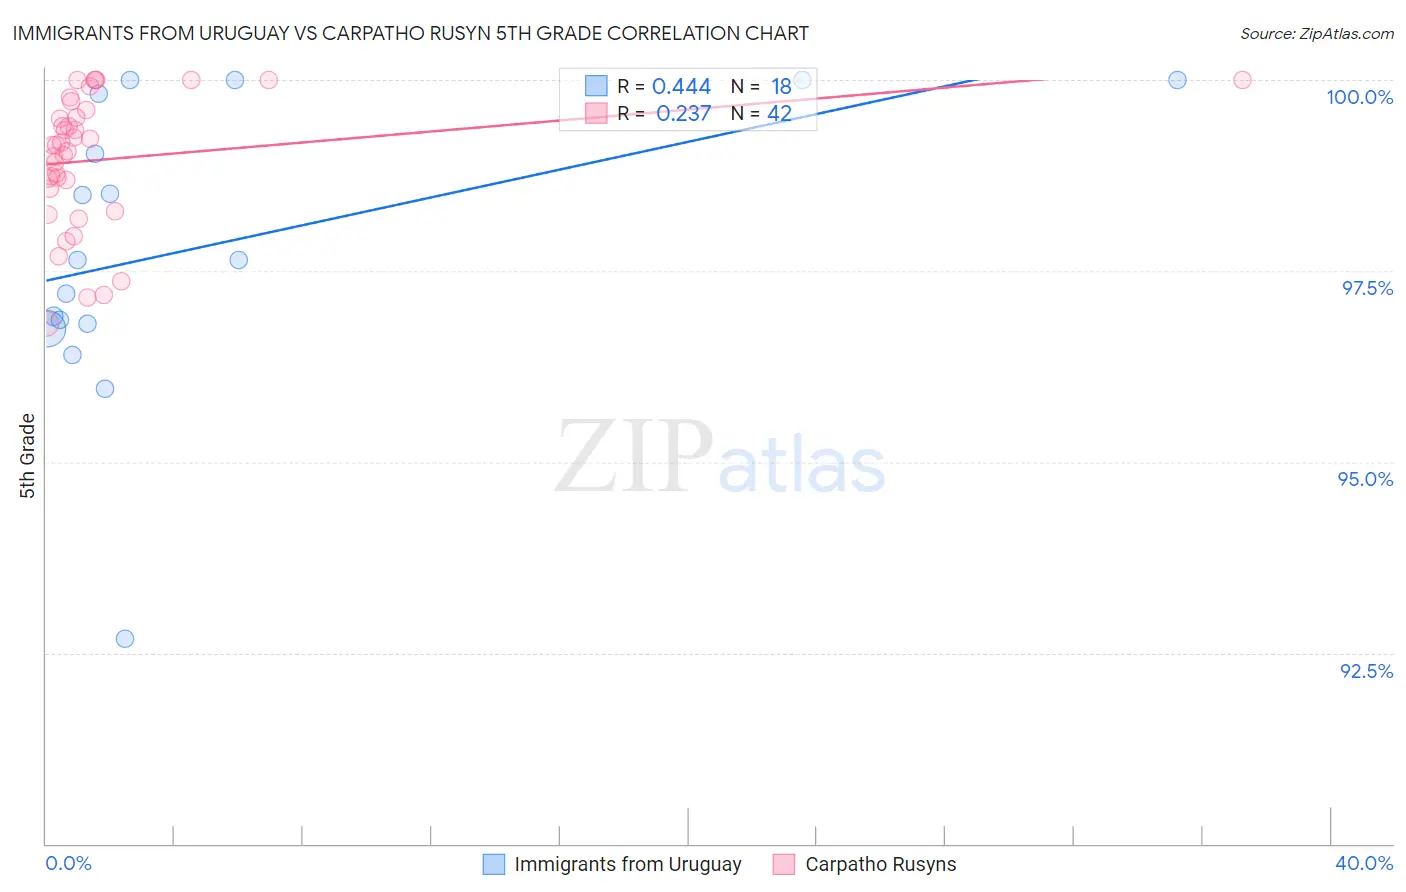
Immigrants from Uruguay vs Carpatho Rusyn 5th Grade Correlation Chart
The statistical analysis conducted on geographies consisting of 133,259,667 people shows a moderate positive correlation between the proportion of Immigrants from Uruguay and percentage of population with at least 5th grade education in the United States with a correlation coefficient (R) of 0.444 and weighted average of 96.9%. Similarly, the statistical analysis conducted on geographies consisting of 58,871,690 people shows a weak positive correlation between the proportion of Carpatho Rusyns and percentage of population with at least 5th grade education in the United States with a correlation coefficient (R) of 0.237 and weighted average of 98.3%, a difference of 1.5%.
5th Grade Correlation Summary
| Measurement | Immigrants from Uruguay | Carpatho Rusyn |
| Minimum | 92.7% | 96.8% |
| Maximum | 100.0% | 100.0% |
| Range | 7.3% | 3.2% |
| Mean | 97.8% | 99.0% |
| Median | 97.6% | 99.1% |
| Interquartile 25% (IQ1) | 96.8% | 98.6% |
| Interquartile 75% (IQ3) | 99.8% | 99.6% |
| Interquartile Range (IQR) | 3.0% | 1.0% |
| Standard Deviation (Sample) | 1.9% | 0.87% |
| Standard Deviation (Population) | 1.9% | 0.86% |
Similar Demographics by 5th Grade
Demographics Similar to Immigrants from Uruguay by 5th Grade
In terms of 5th grade, the demographic groups most similar to Immigrants from Uruguay are Immigrants from Liberia (96.9%, a difference of 0.0%), Bolivian (96.9%, a difference of 0.0%), Immigrants from Africa (96.9%, a difference of 0.010%), U.S. Virgin Islander (96.9%, a difference of 0.010%), and Jamaican (96.9%, a difference of 0.010%).
| Demographics | Rating | Rank | 5th Grade |
| Immigrants | Costa Rica | 1.6 /100 | #242 | Tragic 96.9% |
| Immigrants | Eastern Africa | 1.6 /100 | #243 | Tragic 96.9% |
| Koreans | 1.6 /100 | #244 | Tragic 96.9% |
| Colombians | 1.3 /100 | #245 | Tragic 96.9% |
| Ethiopians | 1.2 /100 | #246 | Tragic 96.9% |
| Immigrants | Africa | 1.1 /100 | #247 | Tragic 96.9% |
| U.S. Virgin Islanders | 1.1 /100 | #248 | Tragic 96.9% |
| Immigrants | Uruguay | 1.0 /100 | #249 | Tragic 96.9% |
| Immigrants | Liberia | 1.0 /100 | #250 | Tragic 96.9% |
| Bolivians | 0.9 /100 | #251 | Tragic 96.9% |
| Jamaicans | 0.9 /100 | #252 | Tragic 96.9% |
| Immigrants | Middle Africa | 0.8 /100 | #253 | Tragic 96.8% |
| Immigrants | Senegal | 0.8 /100 | #254 | Tragic 96.8% |
| South Americans | 0.7 /100 | #255 | Tragic 96.8% |
| Immigrants | Congo | 0.7 /100 | #256 | Tragic 96.8% |
Demographics Similar to Carpatho Rusyns by 5th Grade
In terms of 5th grade, the demographic groups most similar to Carpatho Rusyns are Swedish (98.3%, a difference of 0.010%), English (98.3%, a difference of 0.010%), Alaskan Athabascan (98.3%, a difference of 0.010%), Tlingit-Haida (98.3%, a difference of 0.010%), and Dutch (98.3%, a difference of 0.020%).
| Demographics | Rating | Rank | 5th Grade |
| Slovaks | 100.0 /100 | #5 | Exceptional 98.4% |
| Germans | 100.0 /100 | #6 | Exceptional 98.4% |
| Inupiat | 100.0 /100 | #7 | Exceptional 98.4% |
| Slovenes | 100.0 /100 | #8 | Exceptional 98.3% |
| Swedes | 100.0 /100 | #9 | Exceptional 98.3% |
| English | 100.0 /100 | #10 | Exceptional 98.3% |
| Alaskan Athabascans | 100.0 /100 | #11 | Exceptional 98.3% |
| Carpatho Rusyns | 100.0 /100 | #12 | Exceptional 98.3% |
| Tlingit-Haida | 100.0 /100 | #13 | Exceptional 98.3% |
| Dutch | 100.0 /100 | #14 | Exceptional 98.3% |
| Scottish | 100.0 /100 | #15 | Exceptional 98.3% |
| Poles | 100.0 /100 | #16 | Exceptional 98.3% |
| Irish | 100.0 /100 | #17 | Exceptional 98.3% |
| Pennsylvania Germans | 100.0 /100 | #18 | Exceptional 98.3% |
| Finns | 100.0 /100 | #19 | Exceptional 98.2% |