Immigrants from Uruguay vs Senegalese 5th Grade
COMPARE
Immigrants from Uruguay
Senegalese
5th Grade
5th Grade Comparison
Immigrants from Uruguay
Senegalese
96.9%
5TH GRADE
1.0/ 100
METRIC RATING
249th/ 347
METRIC RANK
97.0%
5TH GRADE
2.8/ 100
METRIC RATING
236th/ 347
METRIC RANK
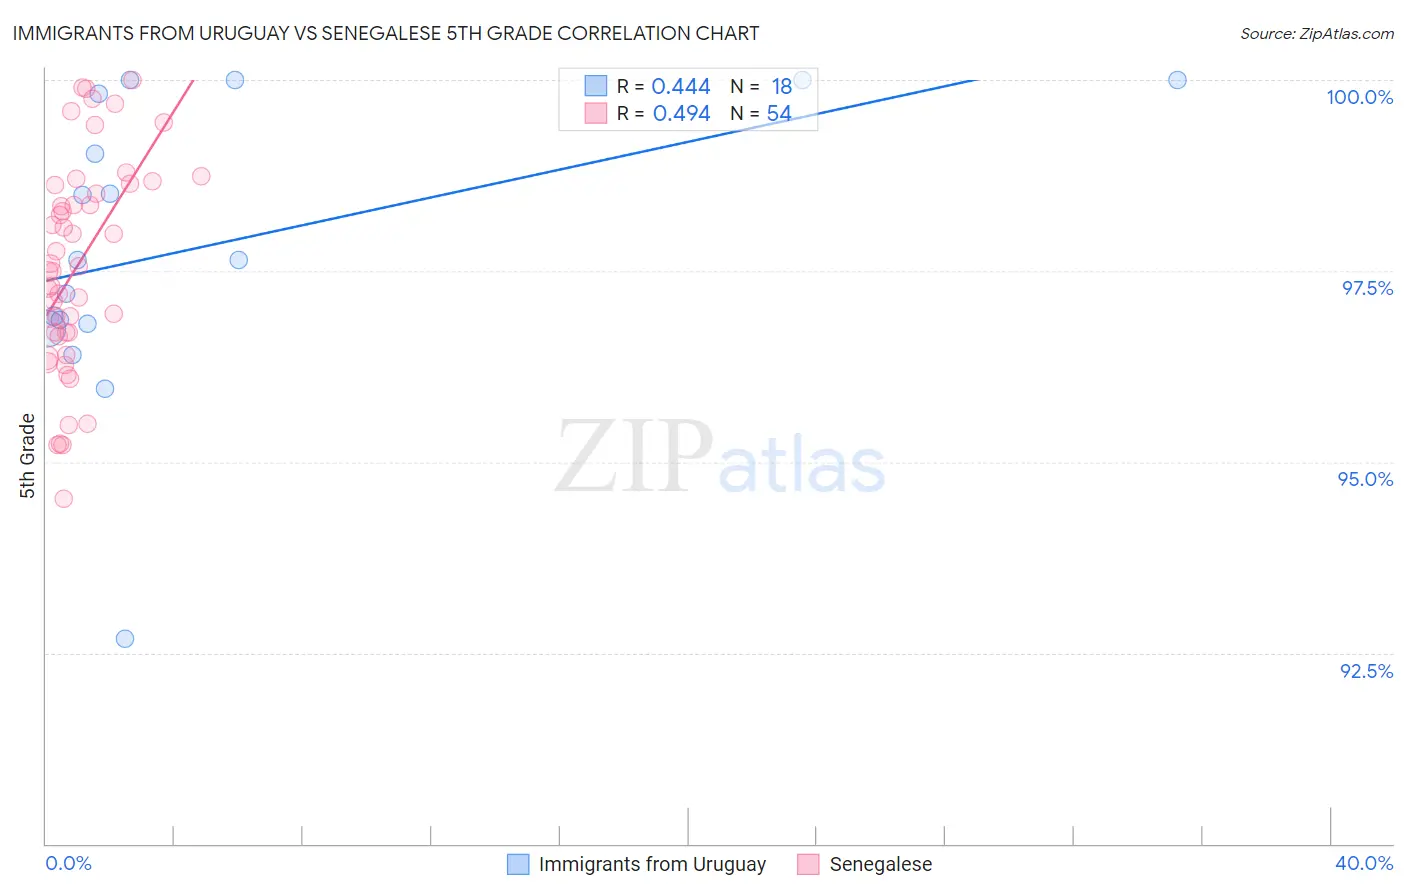
Immigrants from Uruguay vs Senegalese 5th Grade Correlation Chart
The statistical analysis conducted on geographies consisting of 133,259,667 people shows a moderate positive correlation between the proportion of Immigrants from Uruguay and percentage of population with at least 5th grade education in the United States with a correlation coefficient (R) of 0.444 and weighted average of 96.9%. Similarly, the statistical analysis conducted on geographies consisting of 78,142,569 people shows a moderate positive correlation between the proportion of Senegalese and percentage of population with at least 5th grade education in the United States with a correlation coefficient (R) of 0.494 and weighted average of 97.0%, a difference of 0.11%.
5th Grade Correlation Summary
| Measurement | Immigrants from Uruguay | Senegalese |
| Minimum | 92.7% | 94.5% |
| Maximum | 100.0% | 100.0% |
| Range | 7.3% | 5.5% |
| Mean | 97.8% | 97.6% |
| Median | 97.6% | 97.5% |
| Interquartile 25% (IQ1) | 96.8% | 96.7% |
| Interquartile 75% (IQ3) | 99.8% | 98.6% |
| Interquartile Range (IQR) | 3.0% | 1.9% |
| Standard Deviation (Sample) | 1.9% | 1.4% |
| Standard Deviation (Population) | 1.9% | 1.4% |
Demographics Similar to Immigrants from Uruguay and Senegalese by 5th Grade
In terms of 5th grade, the demographic groups most similar to Immigrants from Uruguay are Immigrants from Liberia (96.9%, a difference of 0.0%), Bolivian (96.9%, a difference of 0.0%), Immigrants from Africa (96.9%, a difference of 0.010%), U.S. Virgin Islander (96.9%, a difference of 0.010%), and Jamaican (96.9%, a difference of 0.010%). Similarly, the demographic groups most similar to Senegalese are Subsaharan African (97.0%, a difference of 0.020%), Tohono O'odham (97.0%, a difference of 0.020%), Uruguayan (97.0%, a difference of 0.020%), Immigrants from Indonesia (96.9%, a difference of 0.030%), and Asian (96.9%, a difference of 0.030%).
| Demographics | Rating | Rank | 5th Grade |
| Immigrants | Eastern Asia | 4.0 /100 | #232 | Tragic 97.0% |
| Sub-Saharan Africans | 3.3 /100 | #233 | Tragic 97.0% |
| Tohono O'odham | 3.2 /100 | #234 | Tragic 97.0% |
| Uruguayans | 3.2 /100 | #235 | Tragic 97.0% |
| Senegalese | 2.8 /100 | #236 | Tragic 97.0% |
| Immigrants | Indonesia | 2.0 /100 | #237 | Tragic 96.9% |
| Asians | 2.0 /100 | #238 | Tragic 96.9% |
| Nigerians | 1.9 /100 | #239 | Tragic 96.9% |
| Indians (Asian) | 1.9 /100 | #240 | Tragic 96.9% |
| Immigrants | Asia | 1.7 /100 | #241 | Tragic 96.9% |
| Immigrants | Costa Rica | 1.6 /100 | #242 | Tragic 96.9% |
| Immigrants | Eastern Africa | 1.6 /100 | #243 | Tragic 96.9% |
| Koreans | 1.6 /100 | #244 | Tragic 96.9% |
| Colombians | 1.3 /100 | #245 | Tragic 96.9% |
| Ethiopians | 1.2 /100 | #246 | Tragic 96.9% |
| Immigrants | Africa | 1.1 /100 | #247 | Tragic 96.9% |
| U.S. Virgin Islanders | 1.1 /100 | #248 | Tragic 96.9% |
| Immigrants | Uruguay | 1.0 /100 | #249 | Tragic 96.9% |
| Immigrants | Liberia | 1.0 /100 | #250 | Tragic 96.9% |
| Bolivians | 0.9 /100 | #251 | Tragic 96.9% |
| Jamaicans | 0.9 /100 | #252 | Tragic 96.9% |