Central American vs Carpatho Rusyn 5th Grade
COMPARE
Central American
Carpatho Rusyn
5th Grade
5th Grade Comparison
Central Americans
Carpatho Rusyns
95.1%
5TH GRADE
0.0/ 100
METRIC RATING
337th/ 347
METRIC RANK
98.3%
5TH GRADE
100.0/ 100
METRIC RATING
12th/ 347
METRIC RANK
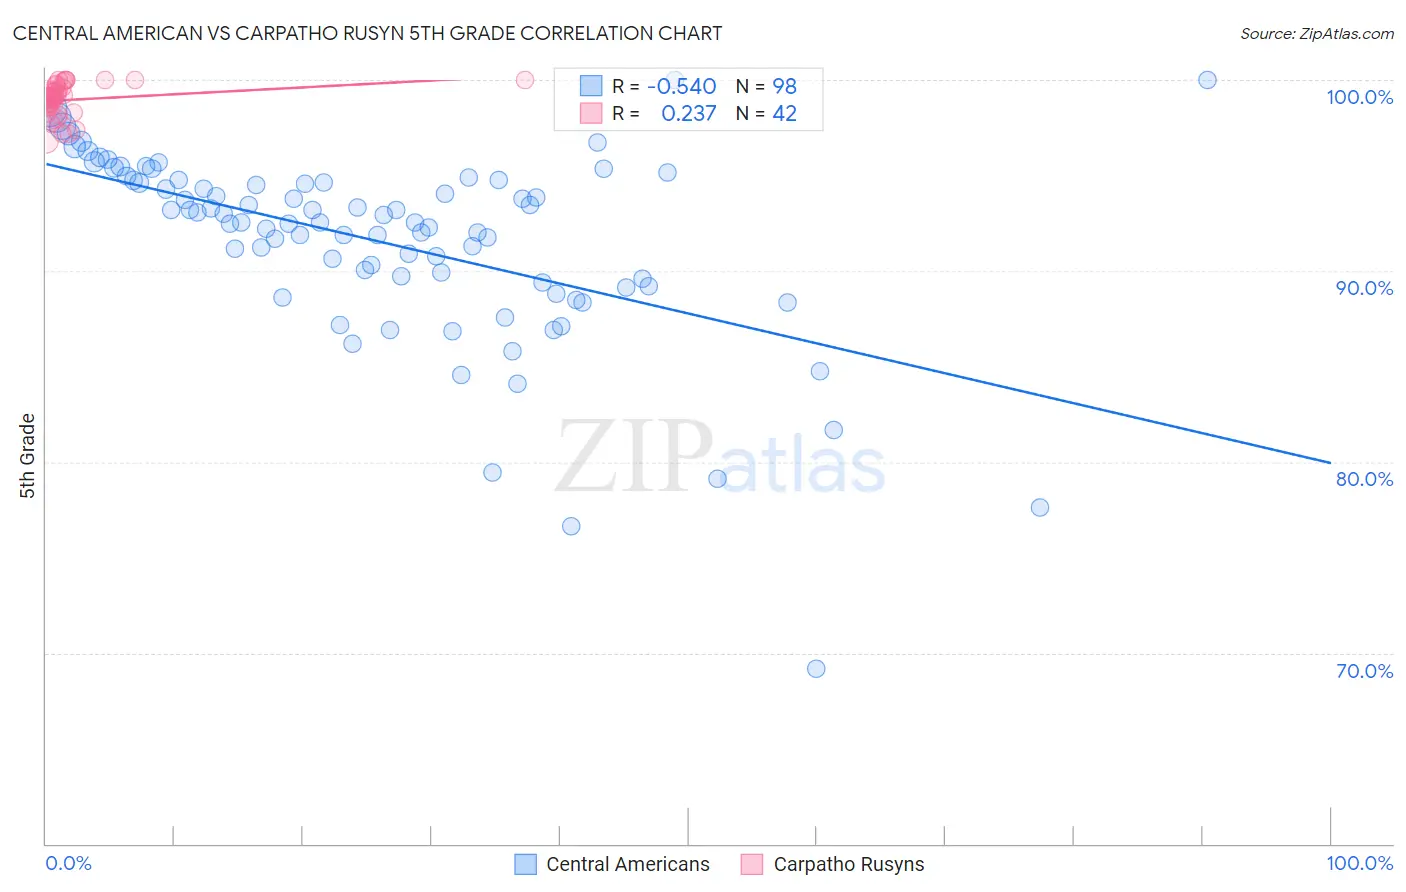
Central American vs Carpatho Rusyn 5th Grade Correlation Chart
The statistical analysis conducted on geographies consisting of 504,619,198 people shows a substantial negative correlation between the proportion of Central Americans and percentage of population with at least 5th grade education in the United States with a correlation coefficient (R) of -0.540 and weighted average of 95.1%. Similarly, the statistical analysis conducted on geographies consisting of 58,871,690 people shows a weak positive correlation between the proportion of Carpatho Rusyns and percentage of population with at least 5th grade education in the United States with a correlation coefficient (R) of 0.237 and weighted average of 98.3%, a difference of 3.4%.
5th Grade Correlation Summary
| Measurement | Central American | Carpatho Rusyn |
| Minimum | 69.2% | 96.8% |
| Maximum | 100.0% | 100.0% |
| Range | 30.8% | 3.2% |
| Mean | 91.5% | 99.0% |
| Median | 92.6% | 99.1% |
| Interquartile 25% (IQ1) | 89.4% | 98.6% |
| Interquartile 75% (IQ3) | 94.7% | 99.6% |
| Interquartile Range (IQR) | 5.3% | 1.0% |
| Standard Deviation (Sample) | 5.0% | 0.87% |
| Standard Deviation (Population) | 5.0% | 0.86% |
Similar Demographics by 5th Grade
Demographics Similar to Central Americans by 5th Grade
In terms of 5th grade, the demographic groups most similar to Central Americans are Immigrants from the Azores (95.1%, a difference of 0.070%), Immigrants from Cabo Verde (94.9%, a difference of 0.16%), Mexican (95.2%, a difference of 0.17%), Nepalese (95.2%, a difference of 0.19%), and Immigrants from Yemen (94.9%, a difference of 0.21%).
| Demographics | Rating | Rank | 5th Grade |
| Immigrants | Armenia | 0.0 /100 | #330 | Tragic 95.4% |
| Immigrants | Honduras | 0.0 /100 | #331 | Tragic 95.4% |
| Immigrants | Dominican Republic | 0.0 /100 | #332 | Tragic 95.3% |
| Immigrants | Latin America | 0.0 /100 | #333 | Tragic 95.3% |
| Nepalese | 0.0 /100 | #334 | Tragic 95.2% |
| Mexicans | 0.0 /100 | #335 | Tragic 95.2% |
| Immigrants | Azores | 0.0 /100 | #336 | Tragic 95.1% |
| Central Americans | 0.0 /100 | #337 | Tragic 95.1% |
| Immigrants | Cabo Verde | 0.0 /100 | #338 | Tragic 94.9% |
| Immigrants | Yemen | 0.0 /100 | #339 | Tragic 94.9% |
| Guatemalans | 0.0 /100 | #340 | Tragic 94.8% |
| Yakama | 0.0 /100 | #341 | Tragic 94.8% |
| Immigrants | Central America | 0.0 /100 | #342 | Tragic 94.7% |
| Salvadorans | 0.0 /100 | #343 | Tragic 94.6% |
| Immigrants | Mexico | 0.0 /100 | #344 | Tragic 94.6% |
Demographics Similar to Carpatho Rusyns by 5th Grade
In terms of 5th grade, the demographic groups most similar to Carpatho Rusyns are Swedish (98.3%, a difference of 0.010%), English (98.3%, a difference of 0.010%), Alaskan Athabascan (98.3%, a difference of 0.010%), Tlingit-Haida (98.3%, a difference of 0.010%), and Dutch (98.3%, a difference of 0.020%).
| Demographics | Rating | Rank | 5th Grade |
| Slovaks | 100.0 /100 | #5 | Exceptional 98.4% |
| Germans | 100.0 /100 | #6 | Exceptional 98.4% |
| Inupiat | 100.0 /100 | #7 | Exceptional 98.4% |
| Slovenes | 100.0 /100 | #8 | Exceptional 98.3% |
| Swedes | 100.0 /100 | #9 | Exceptional 98.3% |
| English | 100.0 /100 | #10 | Exceptional 98.3% |
| Alaskan Athabascans | 100.0 /100 | #11 | Exceptional 98.3% |
| Carpatho Rusyns | 100.0 /100 | #12 | Exceptional 98.3% |
| Tlingit-Haida | 100.0 /100 | #13 | Exceptional 98.3% |
| Dutch | 100.0 /100 | #14 | Exceptional 98.3% |
| Scottish | 100.0 /100 | #15 | Exceptional 98.3% |
| Poles | 100.0 /100 | #16 | Exceptional 98.3% |
| Irish | 100.0 /100 | #17 | Exceptional 98.3% |
| Pennsylvania Germans | 100.0 /100 | #18 | Exceptional 98.3% |
| Finns | 100.0 /100 | #19 | Exceptional 98.2% |