Immigrants from Uruguay vs Immigrants from Uzbekistan 5th Grade
COMPARE
Immigrants from Uruguay
Immigrants from Uzbekistan
5th Grade
5th Grade Comparison
Immigrants from Uruguay
Immigrants from Uzbekistan
96.9%
5TH GRADE
1.0/ 100
METRIC RATING
249th/ 347
METRIC RANK
96.8%
5TH GRADE
0.3/ 100
METRIC RATING
263rd/ 347
METRIC RANK
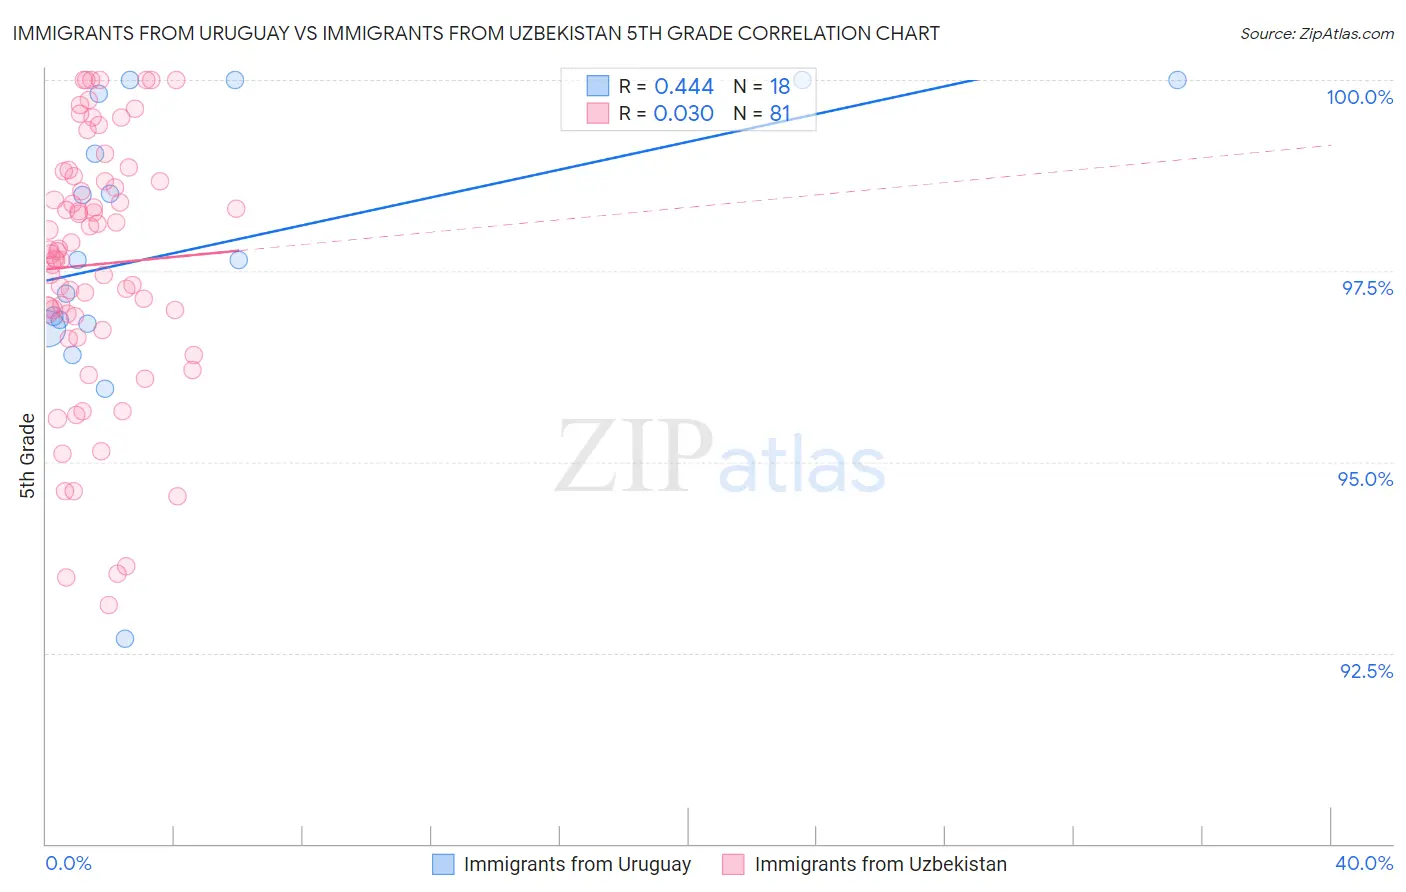
Immigrants from Uruguay vs Immigrants from Uzbekistan 5th Grade Correlation Chart
The statistical analysis conducted on geographies consisting of 133,259,667 people shows a moderate positive correlation between the proportion of Immigrants from Uruguay and percentage of population with at least 5th grade education in the United States with a correlation coefficient (R) of 0.444 and weighted average of 96.9%. Similarly, the statistical analysis conducted on geographies consisting of 118,593,934 people shows no correlation between the proportion of Immigrants from Uzbekistan and percentage of population with at least 5th grade education in the United States with a correlation coefficient (R) of 0.030 and weighted average of 96.8%, a difference of 0.11%.
5th Grade Correlation Summary
| Measurement | Immigrants from Uruguay | Immigrants from Uzbekistan |
| Minimum | 92.7% | 93.1% |
| Maximum | 100.0% | 100.0% |
| Range | 7.3% | 6.9% |
| Mean | 97.8% | 97.6% |
| Median | 97.6% | 97.8% |
| Interquartile 25% (IQ1) | 96.8% | 96.8% |
| Interquartile 75% (IQ3) | 99.8% | 98.7% |
| Interquartile Range (IQR) | 3.0% | 1.9% |
| Standard Deviation (Sample) | 1.9% | 1.7% |
| Standard Deviation (Population) | 1.9% | 1.7% |
Demographics Similar to Immigrants from Uruguay and Immigrants from Uzbekistan by 5th Grade
In terms of 5th grade, the demographic groups most similar to Immigrants from Uruguay are Immigrants from Liberia (96.9%, a difference of 0.0%), Bolivian (96.9%, a difference of 0.0%), Immigrants from Africa (96.9%, a difference of 0.010%), U.S. Virgin Islander (96.9%, a difference of 0.010%), and Jamaican (96.9%, a difference of 0.010%). Similarly, the demographic groups most similar to Immigrants from Uzbekistan are Immigrants from Jamaica (96.8%, a difference of 0.010%), Immigrants from Sierra Leone (96.8%, a difference of 0.010%), Immigrants from Colombia (96.8%, a difference of 0.010%), West Indian (96.8%, a difference of 0.010%), and Taiwanese (96.7%, a difference of 0.010%).
| Demographics | Rating | Rank | 5th Grade |
| Ethiopians | 1.2 /100 | #246 | Tragic 96.9% |
| Immigrants | Africa | 1.1 /100 | #247 | Tragic 96.9% |
| U.S. Virgin Islanders | 1.1 /100 | #248 | Tragic 96.9% |
| Immigrants | Uruguay | 1.0 /100 | #249 | Tragic 96.9% |
| Immigrants | Liberia | 1.0 /100 | #250 | Tragic 96.9% |
| Bolivians | 0.9 /100 | #251 | Tragic 96.9% |
| Jamaicans | 0.9 /100 | #252 | Tragic 96.9% |
| Immigrants | Middle Africa | 0.8 /100 | #253 | Tragic 96.8% |
| Immigrants | Senegal | 0.8 /100 | #254 | Tragic 96.8% |
| South Americans | 0.7 /100 | #255 | Tragic 96.8% |
| Immigrants | Congo | 0.7 /100 | #256 | Tragic 96.8% |
| Peruvians | 0.6 /100 | #257 | Tragic 96.8% |
| Immigrants | Ethiopia | 0.5 /100 | #258 | Tragic 96.8% |
| Immigrants | China | 0.5 /100 | #259 | Tragic 96.8% |
| Immigrants | Jamaica | 0.4 /100 | #260 | Tragic 96.8% |
| Immigrants | Sierra Leone | 0.4 /100 | #261 | Tragic 96.8% |
| Immigrants | Colombia | 0.4 /100 | #262 | Tragic 96.8% |
| Immigrants | Uzbekistan | 0.3 /100 | #263 | Tragic 96.8% |
| West Indians | 0.3 /100 | #264 | Tragic 96.8% |
| Taiwanese | 0.3 /100 | #265 | Tragic 96.7% |
| Immigrants | Nigeria | 0.3 /100 | #266 | Tragic 96.7% |