Immigrants from Uruguay vs Arab Family Households with Children
COMPARE
Immigrants from Uruguay
Arab
Family Households with Children
Family Households with Children Comparison
Immigrants from Uruguay
Arabs
27.4%
FAMILY HOUSEHOLDS WITH CHILDREN
37.7/ 100
METRIC RATING
190th/ 347
METRIC RANK
28.0%
FAMILY HOUSEHOLDS WITH CHILDREN
97.0/ 100
METRIC RATING
113th/ 347
METRIC RANK
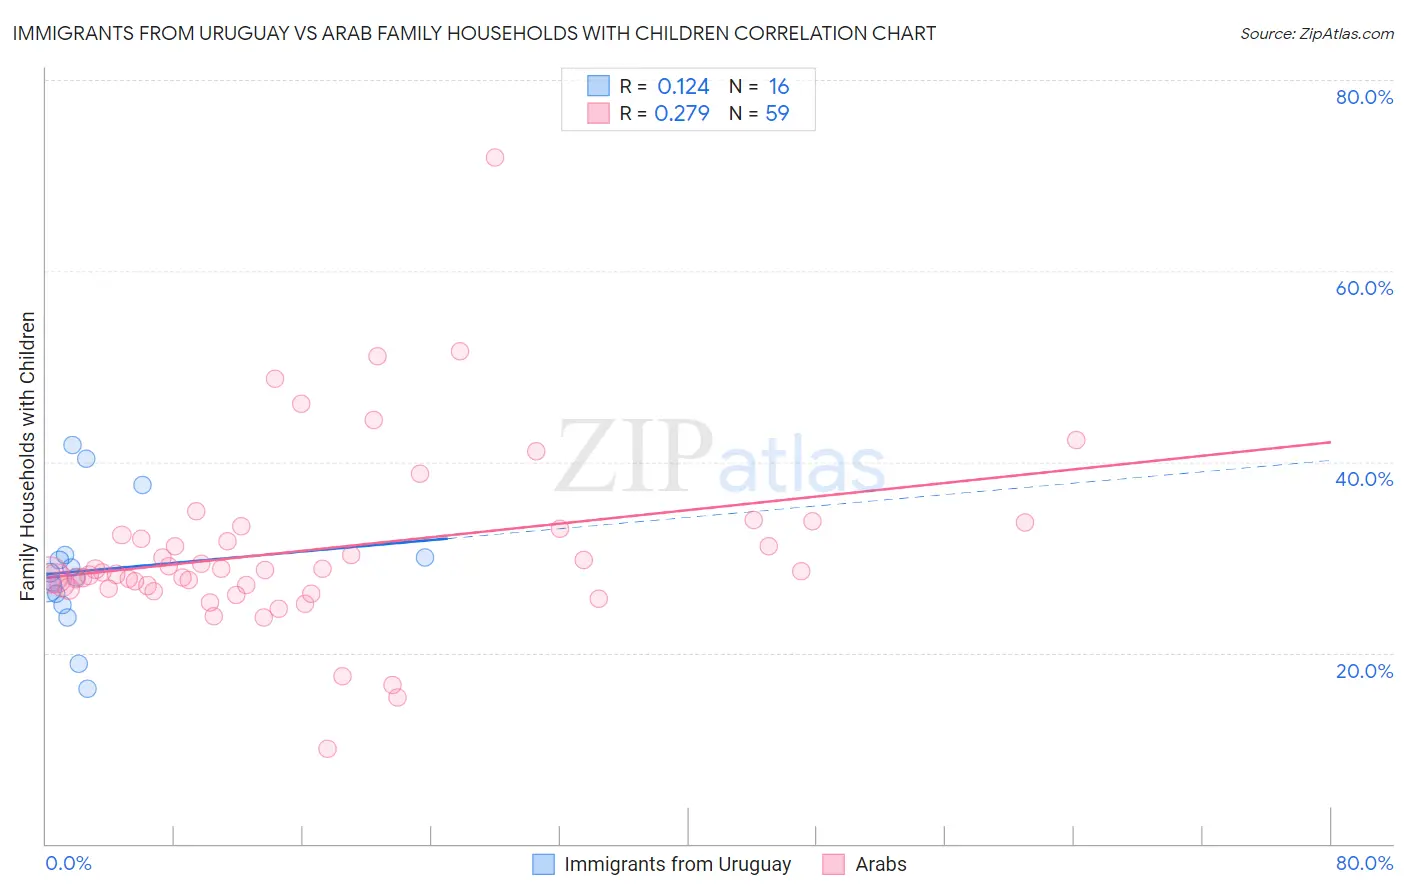
Immigrants from Uruguay vs Arab Family Households with Children Correlation Chart
The statistical analysis conducted on geographies consisting of 133,231,566 people shows a poor positive correlation between the proportion of Immigrants from Uruguay and percentage of family households with children in the United States with a correlation coefficient (R) of 0.124 and weighted average of 27.4%. Similarly, the statistical analysis conducted on geographies consisting of 486,135,019 people shows a weak positive correlation between the proportion of Arabs and percentage of family households with children in the United States with a correlation coefficient (R) of 0.279 and weighted average of 28.0%, a difference of 2.2%.
Family Households with Children Correlation Summary
| Measurement | Immigrants from Uruguay | Arab |
| Minimum | 16.2% | 10.0% |
| Maximum | 41.7% | 71.9% |
| Range | 25.5% | 61.9% |
| Mean | 28.7% | 30.8% |
| Median | 28.1% | 28.6% |
| Interquartile 25% (IQ1) | 25.6% | 26.7% |
| Interquartile 75% (IQ3) | 30.1% | 33.0% |
| Interquartile Range (IQR) | 4.5% | 6.2% |
| Standard Deviation (Sample) | 6.8% | 9.4% |
| Standard Deviation (Population) | 6.6% | 9.4% |
Similar Demographics by Family Households with Children
Demographics Similar to Immigrants from Uruguay by Family Households with Children
In terms of family households with children, the demographic groups most similar to Immigrants from Uruguay are Sudanese (27.4%, a difference of 0.0%), Pennsylvania German (27.4%, a difference of 0.0%), Immigrants from Israel (27.4%, a difference of 0.010%), Swedish (27.4%, a difference of 0.020%), and Dutch (27.4%, a difference of 0.030%).
| Demographics | Rating | Rank | Family Households with Children |
| South Africans | 44.9 /100 | #183 | Average 27.4% |
| Native Hawaiians | 44.6 /100 | #184 | Average 27.4% |
| Delaware | 42.0 /100 | #185 | Average 27.4% |
| Immigrants | Brazil | 40.6 /100 | #186 | Average 27.4% |
| Creek | 39.8 /100 | #187 | Fair 27.4% |
| Dutch | 38.8 /100 | #188 | Fair 27.4% |
| Immigrants | Israel | 37.9 /100 | #189 | Fair 27.4% |
| Immigrants | Uruguay | 37.7 /100 | #190 | Fair 27.4% |
| Sudanese | 37.6 /100 | #191 | Fair 27.4% |
| Pennsylvania Germans | 37.5 /100 | #192 | Fair 27.4% |
| Swedes | 36.9 /100 | #193 | Fair 27.4% |
| Immigrants | Iran | 36.1 /100 | #194 | Fair 27.4% |
| Crow | 35.7 /100 | #195 | Fair 27.4% |
| Cheyenne | 35.1 /100 | #196 | Fair 27.4% |
| Norwegians | 35.0 /100 | #197 | Fair 27.4% |
Demographics Similar to Arabs by Family Households with Children
In terms of family households with children, the demographic groups most similar to Arabs are Immigrants from Middle Africa (28.0%, a difference of 0.010%), South American Indian (28.0%, a difference of 0.020%), Scandinavian (28.0%, a difference of 0.030%), Immigrants from Africa (28.0%, a difference of 0.030%), and Spaniard (28.0%, a difference of 0.10%).
| Demographics | Rating | Rank | Family Households with Children |
| Immigrants | South America | 98.0 /100 | #106 | Exceptional 28.0% |
| Immigrants | Uganda | 97.7 /100 | #107 | Exceptional 28.0% |
| Immigrants | Burma/Myanmar | 97.7 /100 | #108 | Exceptional 28.0% |
| Tohono O'odham | 97.6 /100 | #109 | Exceptional 28.0% |
| Spaniards | 97.4 /100 | #110 | Exceptional 28.0% |
| Scandinavians | 97.1 /100 | #111 | Exceptional 28.0% |
| Immigrants | Middle Africa | 97.0 /100 | #112 | Exceptional 28.0% |
| Arabs | 97.0 /100 | #113 | Exceptional 28.0% |
| South American Indians | 96.9 /100 | #114 | Exceptional 28.0% |
| Immigrants | Africa | 96.8 /100 | #115 | Exceptional 28.0% |
| Pakistanis | 96.0 /100 | #116 | Exceptional 27.9% |
| Immigrants | Malaysia | 95.9 /100 | #117 | Exceptional 27.9% |
| Central American Indians | 95.9 /100 | #118 | Exceptional 27.9% |
| Zimbabweans | 95.6 /100 | #119 | Exceptional 27.9% |
| Europeans | 95.4 /100 | #120 | Exceptional 27.9% |