Immigrants from Vietnam vs Liberian 12th Grade, No Diploma
COMPARE
Immigrants from Vietnam
Liberian
12th Grade, No Diploma
12th Grade, No Diploma Comparison
Immigrants from Vietnam
Liberians
88.7%
12TH GRADE, NO DIPLOMA
0.0/ 100
METRIC RATING
282nd/ 347
METRIC RANK
90.8%
12TH GRADE, NO DIPLOMA
19.8/ 100
METRIC RATING
200th/ 347
METRIC RANK
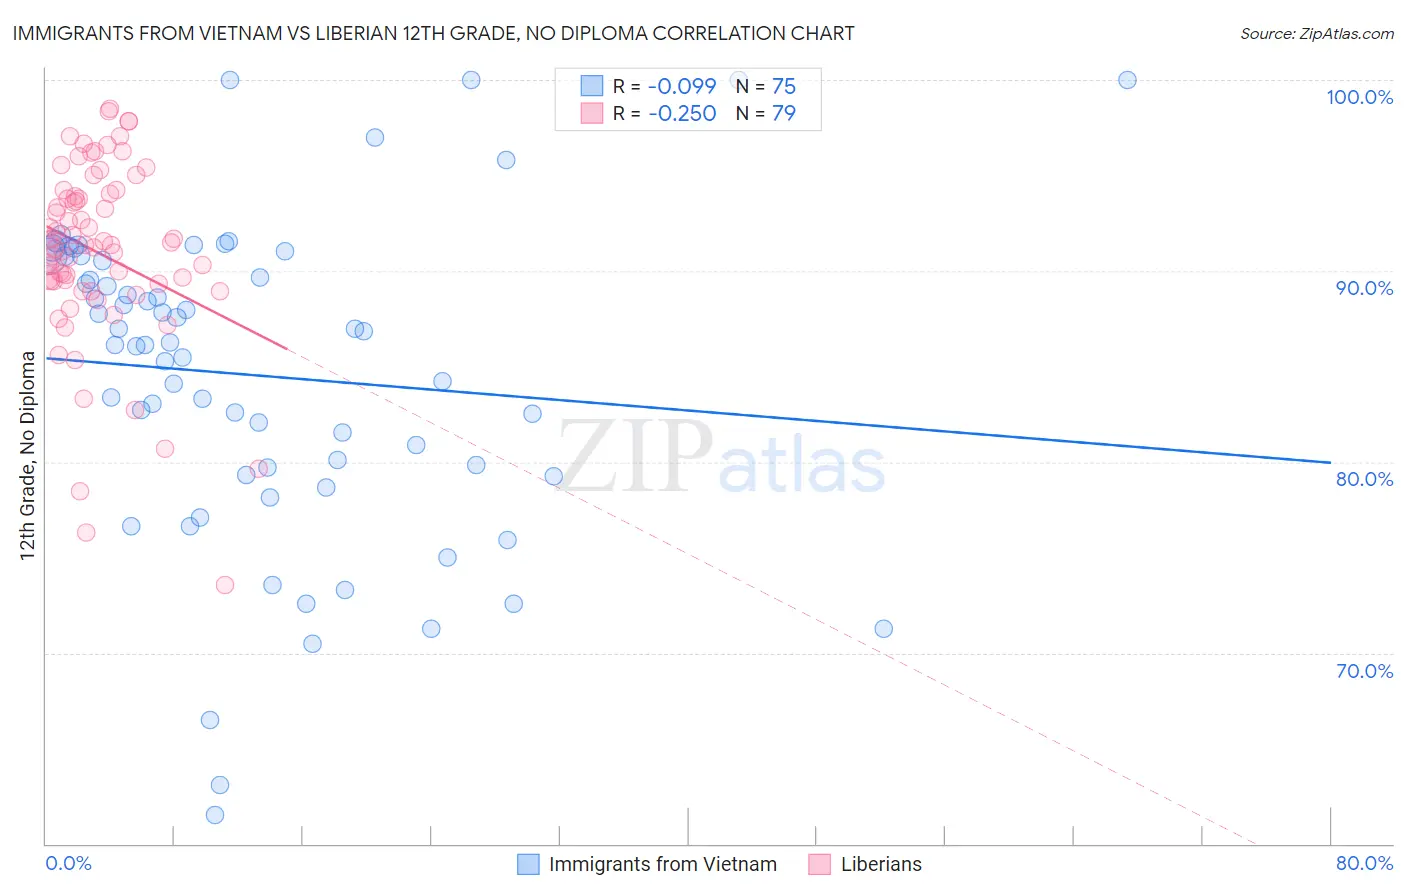
Immigrants from Vietnam vs Liberian 12th Grade, No Diploma Correlation Chart
The statistical analysis conducted on geographies consisting of 404,843,921 people shows a slight negative correlation between the proportion of Immigrants from Vietnam and percentage of population with at least 12th grade (no diploma) education in the United States with a correlation coefficient (R) of -0.099 and weighted average of 88.7%. Similarly, the statistical analysis conducted on geographies consisting of 118,101,728 people shows a weak negative correlation between the proportion of Liberians and percentage of population with at least 12th grade (no diploma) education in the United States with a correlation coefficient (R) of -0.250 and weighted average of 90.8%, a difference of 2.3%.
12th Grade, No Diploma Correlation Summary
| Measurement | Immigrants from Vietnam | Liberian |
| Minimum | 61.5% | 73.6% |
| Maximum | 100.0% | 98.5% |
| Range | 38.5% | 25.0% |
| Mean | 84.5% | 91.0% |
| Median | 86.1% | 91.4% |
| Interquartile 25% (IQ1) | 79.3% | 89.3% |
| Interquartile 75% (IQ3) | 90.7% | 94.0% |
| Interquartile Range (IQR) | 11.5% | 4.7% |
| Standard Deviation (Sample) | 8.3% | 4.9% |
| Standard Deviation (Population) | 8.2% | 4.8% |
Similar Demographics by 12th Grade, No Diploma
Demographics Similar to Immigrants from Vietnam by 12th Grade, No Diploma
In terms of 12th grade, no diploma, the demographic groups most similar to Immigrants from Vietnam are Paiute (88.7%, a difference of 0.060%), Pennsylvania German (88.7%, a difference of 0.070%), Indonesian (88.6%, a difference of 0.080%), Immigrants from West Indies (88.6%, a difference of 0.090%), and Hopi (88.6%, a difference of 0.090%).
| Demographics | Rating | Rank | 12th Grade, No Diploma |
| Immigrants | Congo | 0.1 /100 | #275 | Tragic 89.0% |
| Ute | 0.1 /100 | #276 | Tragic 89.0% |
| Immigrants | Barbados | 0.0 /100 | #277 | Tragic 89.0% |
| Immigrants | St. Vincent and the Grenadines | 0.0 /100 | #278 | Tragic 88.9% |
| Immigrants | Laos | 0.0 /100 | #279 | Tragic 88.9% |
| Immigrants | Burma/Myanmar | 0.0 /100 | #280 | Tragic 88.9% |
| Cubans | 0.0 /100 | #281 | Tragic 88.9% |
| Immigrants | Vietnam | 0.0 /100 | #282 | Tragic 88.7% |
| Paiute | 0.0 /100 | #283 | Tragic 88.7% |
| Pennsylvania Germans | 0.0 /100 | #284 | Tragic 88.7% |
| Indonesians | 0.0 /100 | #285 | Tragic 88.6% |
| Immigrants | West Indies | 0.0 /100 | #286 | Tragic 88.6% |
| Hopi | 0.0 /100 | #287 | Tragic 88.6% |
| Immigrants | Fiji | 0.0 /100 | #288 | Tragic 88.6% |
| Dutch West Indians | 0.0 /100 | #289 | Tragic 88.5% |
Demographics Similar to Liberians by 12th Grade, No Diploma
In terms of 12th grade, no diploma, the demographic groups most similar to Liberians are Immigrants from Southern Europe (90.8%, a difference of 0.0%), Hawaiian (90.8%, a difference of 0.0%), Samoan (90.8%, a difference of 0.010%), Marshallese (90.7%, a difference of 0.030%), and Panamanian (90.8%, a difference of 0.050%).
| Demographics | Rating | Rank | 12th Grade, No Diploma |
| Immigrants | Ethiopia | 27.2 /100 | #193 | Fair 90.9% |
| Immigrants | Oceania | 26.0 /100 | #194 | Fair 90.9% |
| Koreans | 24.5 /100 | #195 | Fair 90.8% |
| Panamanians | 22.8 /100 | #196 | Fair 90.8% |
| Immigrants | Sudan | 22.6 /100 | #197 | Fair 90.8% |
| Samoans | 20.4 /100 | #198 | Fair 90.8% |
| Immigrants | Southern Europe | 19.9 /100 | #199 | Poor 90.8% |
| Liberians | 19.8 /100 | #200 | Poor 90.8% |
| Hawaiians | 19.7 /100 | #201 | Poor 90.8% |
| Marshallese | 18.2 /100 | #202 | Poor 90.7% |
| Tongans | 16.1 /100 | #203 | Poor 90.7% |
| French American Indians | 15.5 /100 | #204 | Poor 90.7% |
| Immigrants | Sierra Leone | 14.9 /100 | #205 | Poor 90.7% |
| Immigrants | Bolivia | 12.3 /100 | #206 | Poor 90.6% |
| Armenians | 11.6 /100 | #207 | Poor 90.6% |