Immigrants from Uganda vs Immigrants from Trinidad and Tobago Kindergarten
COMPARE
Immigrants from Uganda
Immigrants from Trinidad and Tobago
Kindergarten
Kindergarten Comparison
Immigrants from Uganda
Immigrants from Trinidad and Tobago
97.8%
KINDERGARTEN
18.8/ 100
METRIC RATING
203rd/ 347
METRIC RANK
97.3%
KINDERGARTEN
0.0/ 100
METRIC RATING
284th/ 347
METRIC RANK
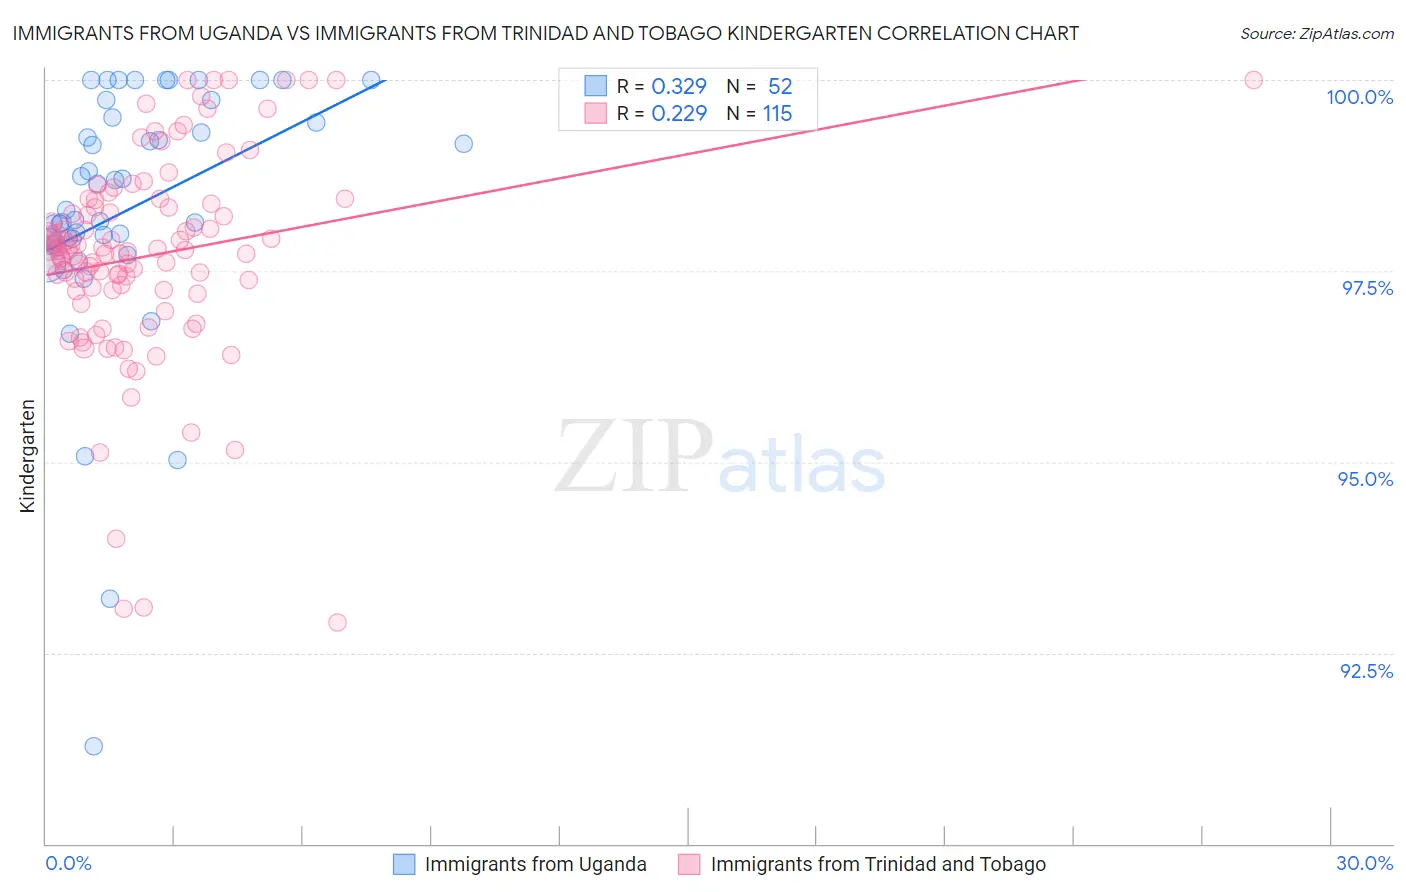
Immigrants from Uganda vs Immigrants from Trinidad and Tobago Kindergarten Correlation Chart
The statistical analysis conducted on geographies consisting of 125,941,298 people shows a mild positive correlation between the proportion of Immigrants from Uganda and percentage of population with at least kindergarten education in the United States with a correlation coefficient (R) of 0.329 and weighted average of 97.8%. Similarly, the statistical analysis conducted on geographies consisting of 223,545,304 people shows a weak positive correlation between the proportion of Immigrants from Trinidad and Tobago and percentage of population with at least kindergarten education in the United States with a correlation coefficient (R) of 0.229 and weighted average of 97.3%, a difference of 0.52%.
Kindergarten Correlation Summary
| Measurement | Immigrants from Uganda | Immigrants from Trinidad and Tobago |
| Minimum | 91.3% | 92.9% |
| Maximum | 100.0% | 100.0% |
| Range | 8.7% | 7.1% |
| Mean | 98.3% | 97.7% |
| Median | 98.2% | 97.8% |
| Interquartile 25% (IQ1) | 97.9% | 97.2% |
| Interquartile 75% (IQ3) | 99.5% | 98.4% |
| Interquartile Range (IQR) | 1.6% | 1.1% |
| Standard Deviation (Sample) | 1.7% | 1.3% |
| Standard Deviation (Population) | 1.7% | 1.3% |
Similar Demographics by Kindergarten
Demographics Similar to Immigrants from Uganda by Kindergarten
In terms of kindergarten, the demographic groups most similar to Immigrants from Uganda are Immigrants from Ukraine (97.8%, a difference of 0.0%), Immigrants from Chile (97.8%, a difference of 0.0%), Immigrants from Southern Europe (97.8%, a difference of 0.0%), Yuman (97.9%, a difference of 0.010%), and Immigrants from Lebanon (97.9%, a difference of 0.010%).
| Demographics | Rating | Rank | Kindergarten |
| Guamanians/Chamorros | 26.2 /100 | #196 | Fair 97.9% |
| Immigrants | Kenya | 25.5 /100 | #197 | Fair 97.9% |
| Tohono O'odham | 24.6 /100 | #198 | Fair 97.9% |
| Immigrants | Egypt | 22.3 /100 | #199 | Fair 97.9% |
| Yuman | 21.6 /100 | #200 | Fair 97.9% |
| Immigrants | Lebanon | 20.9 /100 | #201 | Fair 97.9% |
| Immigrants | Ukraine | 19.1 /100 | #202 | Poor 97.8% |
| Immigrants | Uganda | 18.8 /100 | #203 | Poor 97.8% |
| Immigrants | Chile | 18.1 /100 | #204 | Poor 97.8% |
| Immigrants | Southern Europe | 18.0 /100 | #205 | Poor 97.8% |
| Immigrants | Albania | 16.4 /100 | #206 | Poor 97.8% |
| Africans | 16.1 /100 | #207 | Poor 97.8% |
| Immigrants | Northern Africa | 12.0 /100 | #208 | Poor 97.8% |
| Costa Ricans | 11.6 /100 | #209 | Poor 97.8% |
| Immigrants | Oceania | 11.1 /100 | #210 | Poor 97.8% |
Demographics Similar to Immigrants from Trinidad and Tobago by Kindergarten
In terms of kindergarten, the demographic groups most similar to Immigrants from Trinidad and Tobago are Immigrants from West Indies (97.3%, a difference of 0.010%), Immigrants from Portugal (97.3%, a difference of 0.010%), Immigrants from Barbados (97.3%, a difference of 0.020%), Immigrants from Hong Kong (97.3%, a difference of 0.020%), and Immigrants from Thailand (97.3%, a difference of 0.030%).
| Demographics | Rating | Rank | Kindergarten |
| Immigrants | Western Africa | 0.1 /100 | #277 | Tragic 97.4% |
| Immigrants | Uzbekistan | 0.1 /100 | #278 | Tragic 97.4% |
| Immigrants | Ghana | 0.1 /100 | #279 | Tragic 97.4% |
| Barbadians | 0.1 /100 | #280 | Tragic 97.4% |
| Trinidadians and Tobagonians | 0.1 /100 | #281 | Tragic 97.4% |
| Afghans | 0.0 /100 | #282 | Tragic 97.4% |
| Immigrants | West Indies | 0.0 /100 | #283 | Tragic 97.3% |
| Immigrants | Trinidad and Tobago | 0.0 /100 | #284 | Tragic 97.3% |
| Immigrants | Portugal | 0.0 /100 | #285 | Tragic 97.3% |
| Immigrants | Barbados | 0.0 /100 | #286 | Tragic 97.3% |
| Immigrants | Hong Kong | 0.0 /100 | #287 | Tragic 97.3% |
| Immigrants | Thailand | 0.0 /100 | #288 | Tragic 97.3% |
| Immigrants | Afghanistan | 0.0 /100 | #289 | Tragic 97.3% |
| Immigrants | St. Vincent and the Grenadines | 0.0 /100 | #290 | Tragic 97.3% |
| Houma | 0.0 /100 | #291 | Tragic 97.3% |