Northern European vs Carpatho Rusyn 3rd Grade
COMPARE
Northern European
Carpatho Rusyn
3rd Grade
3rd Grade Comparison
Northern Europeans
Carpatho Rusyns
98.3%
3RD GRADE
99.9/ 100
METRIC RATING
43rd/ 347
METRIC RANK
98.5%
3RD GRADE
100.0/ 100
METRIC RATING
14th/ 347
METRIC RANK
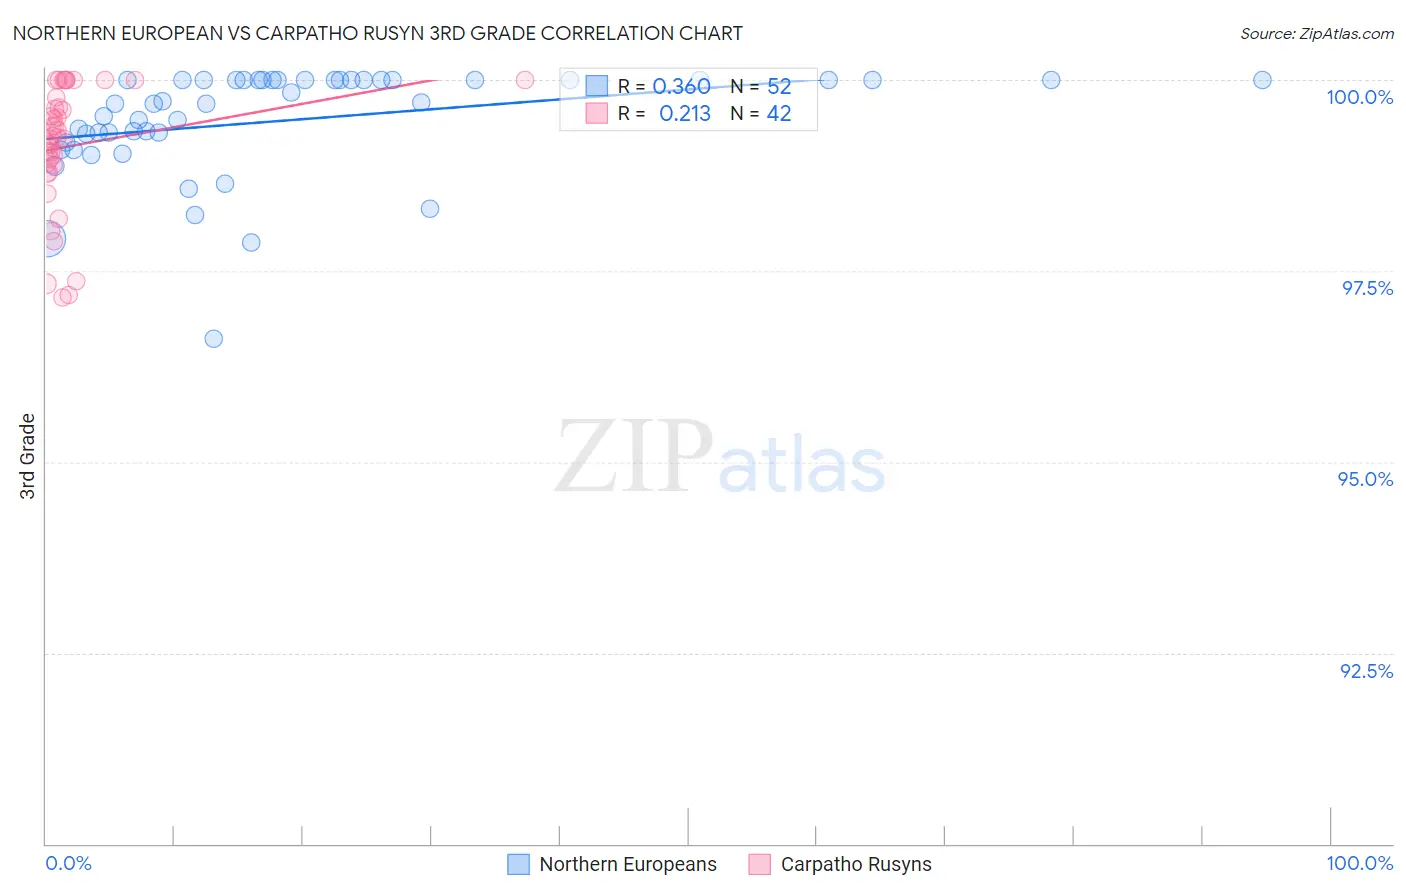
Northern European vs Carpatho Rusyn 3rd Grade Correlation Chart
The statistical analysis conducted on geographies consisting of 406,093,361 people shows a mild positive correlation between the proportion of Northern Europeans and percentage of population with at least 3rd grade education in the United States with a correlation coefficient (R) of 0.360 and weighted average of 98.3%. Similarly, the statistical analysis conducted on geographies consisting of 58,871,690 people shows a weak positive correlation between the proportion of Carpatho Rusyns and percentage of population with at least 3rd grade education in the United States with a correlation coefficient (R) of 0.213 and weighted average of 98.5%, a difference of 0.22%.
3rd Grade Correlation Summary
| Measurement | Northern European | Carpatho Rusyn |
| Minimum | 96.6% | 97.2% |
| Maximum | 100.0% | 100.0% |
| Range | 3.4% | 2.8% |
| Mean | 99.5% | 99.1% |
| Median | 99.7% | 99.3% |
| Interquartile 25% (IQ1) | 99.2% | 98.9% |
| Interquartile 75% (IQ3) | 100.0% | 99.8% |
| Interquartile Range (IQR) | 0.76% | 0.88% |
| Standard Deviation (Sample) | 0.71% | 0.82% |
| Standard Deviation (Population) | 0.70% | 0.81% |
Similar Demographics by 3rd Grade
Demographics Similar to Northern Europeans by 3rd Grade
In terms of 3rd grade, the demographic groups most similar to Northern Europeans are Luxembourger (98.3%, a difference of 0.010%), Belgian (98.3%, a difference of 0.010%), Hungarian (98.3%, a difference of 0.010%), Native Hawaiian (98.3%, a difference of 0.010%), and Eastern European (98.3%, a difference of 0.020%).
| Demographics | Rating | Rank | 3rd Grade |
| British | 99.9 /100 | #36 | Exceptional 98.4% |
| Italians | 99.9 /100 | #37 | Exceptional 98.4% |
| Chippewa | 99.9 /100 | #38 | Exceptional 98.4% |
| Latvians | 99.9 /100 | #39 | Exceptional 98.4% |
| Eastern Europeans | 99.9 /100 | #40 | Exceptional 98.3% |
| Luxembourgers | 99.9 /100 | #41 | Exceptional 98.3% |
| Belgians | 99.9 /100 | #42 | Exceptional 98.3% |
| Northern Europeans | 99.9 /100 | #43 | Exceptional 98.3% |
| Hungarians | 99.9 /100 | #44 | Exceptional 98.3% |
| Native Hawaiians | 99.9 /100 | #45 | Exceptional 98.3% |
| Ottawa | 99.8 /100 | #46 | Exceptional 98.3% |
| Czechoslovakians | 99.8 /100 | #47 | Exceptional 98.3% |
| Lumbee | 99.8 /100 | #48 | Exceptional 98.3% |
| Estonians | 99.8 /100 | #49 | Exceptional 98.3% |
| Celtics | 99.8 /100 | #50 | Exceptional 98.3% |
Demographics Similar to Carpatho Rusyns by 3rd Grade
In terms of 3rd grade, the demographic groups most similar to Carpatho Rusyns are English (98.6%, a difference of 0.0%), Tlingit-Haida (98.5%, a difference of 0.0%), Swedish (98.5%, a difference of 0.010%), Slovene (98.6%, a difference of 0.020%), and Alaska Native (98.6%, a difference of 0.030%).
| Demographics | Rating | Rank | 3rd Grade |
| Norwegians | 100.0 /100 | #7 | Exceptional 98.6% |
| Slovaks | 100.0 /100 | #8 | Exceptional 98.6% |
| Germans | 100.0 /100 | #9 | Exceptional 98.6% |
| Alaska Natives | 100.0 /100 | #10 | Exceptional 98.6% |
| Slovenes | 100.0 /100 | #11 | Exceptional 98.6% |
| English | 100.0 /100 | #12 | Exceptional 98.6% |
| Tlingit-Haida | 100.0 /100 | #13 | Exceptional 98.5% |
| Carpatho Rusyns | 100.0 /100 | #14 | Exceptional 98.5% |
| Swedes | 100.0 /100 | #15 | Exceptional 98.5% |
| Scottish | 100.0 /100 | #16 | Exceptional 98.5% |
| Dutch | 100.0 /100 | #17 | Exceptional 98.5% |
| Irish | 100.0 /100 | #18 | Exceptional 98.5% |
| Poles | 100.0 /100 | #19 | Exceptional 98.5% |
| Pennsylvania Germans | 100.0 /100 | #20 | Exceptional 98.5% |
| Lithuanians | 100.0 /100 | #21 | Exceptional 98.5% |