Immigrants from Uganda vs Immigrants from Eritrea 3rd Grade
COMPARE
Immigrants from Uganda
Immigrants from Eritrea
3rd Grade
3rd Grade Comparison
Immigrants from Uganda
Immigrants from Eritrea
97.7%
3RD GRADE
27.4/ 100
METRIC RATING
194th/ 347
METRIC RANK
97.0%
3RD GRADE
0.0/ 100
METRIC RATING
295th/ 347
METRIC RANK
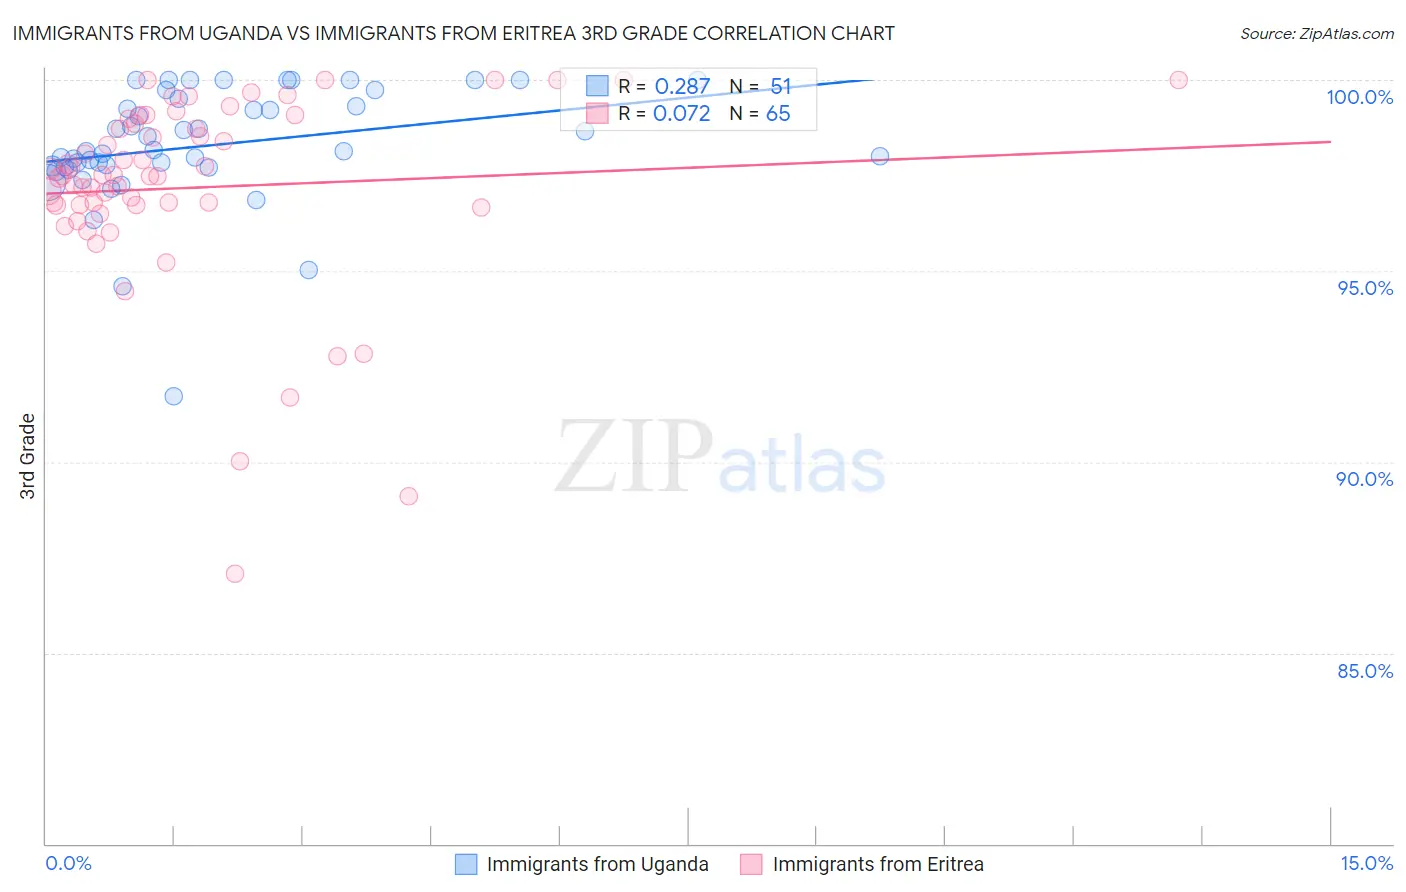
Immigrants from Uganda vs Immigrants from Eritrea 3rd Grade Correlation Chart
The statistical analysis conducted on geographies consisting of 125,908,537 people shows a weak positive correlation between the proportion of Immigrants from Uganda and percentage of population with at least 3rd grade education in the United States with a correlation coefficient (R) of 0.287 and weighted average of 97.7%. Similarly, the statistical analysis conducted on geographies consisting of 104,801,381 people shows a slight positive correlation between the proportion of Immigrants from Eritrea and percentage of population with at least 3rd grade education in the United States with a correlation coefficient (R) of 0.072 and weighted average of 97.0%, a difference of 0.72%.
3rd Grade Correlation Summary
| Measurement | Immigrants from Uganda | Immigrants from Eritrea |
| Minimum | 91.7% | 87.1% |
| Maximum | 100.0% | 100.0% |
| Range | 8.3% | 12.9% |
| Mean | 98.3% | 97.2% |
| Median | 98.1% | 97.5% |
| Interquartile 25% (IQ1) | 97.7% | 96.7% |
| Interquartile 75% (IQ3) | 99.5% | 98.9% |
| Interquartile Range (IQR) | 1.8% | 2.2% |
| Standard Deviation (Sample) | 1.6% | 2.6% |
| Standard Deviation (Population) | 1.5% | 2.5% |
Similar Demographics by 3rd Grade
Demographics Similar to Immigrants from Uganda by 3rd Grade
In terms of 3rd grade, the demographic groups most similar to Immigrants from Uganda are Immigrants from Kenya (97.7%, a difference of 0.0%), Immigrants from Egypt (97.7%, a difference of 0.0%), Black/African American (97.7%, a difference of 0.010%), Mongolian (97.7%, a difference of 0.010%), and Paraguayan (97.7%, a difference of 0.010%).
| Demographics | Rating | Rank | 3rd Grade |
| Natives/Alaskans | 35.2 /100 | #187 | Fair 97.7% |
| Immigrants | Taiwan | 34.2 /100 | #188 | Fair 97.7% |
| Pakistanis | 34.2 /100 | #189 | Fair 97.7% |
| Panamanians | 31.5 /100 | #190 | Fair 97.7% |
| Blacks/African Americans | 29.6 /100 | #191 | Fair 97.7% |
| Mongolians | 29.1 /100 | #192 | Fair 97.7% |
| Immigrants | Kenya | 28.2 /100 | #193 | Fair 97.7% |
| Immigrants | Uganda | 27.4 /100 | #194 | Fair 97.7% |
| Immigrants | Egypt | 26.8 /100 | #195 | Fair 97.7% |
| Paraguayans | 26.2 /100 | #196 | Fair 97.7% |
| Hawaiians | 25.7 /100 | #197 | Fair 97.7% |
| Guamanians/Chamorros | 23.6 /100 | #198 | Fair 97.7% |
| Immigrants | Ukraine | 22.7 /100 | #199 | Fair 97.7% |
| Immigrants | Albania | 22.6 /100 | #200 | Fair 97.7% |
| Immigrants | Lebanon | 21.7 /100 | #201 | Fair 97.7% |
Demographics Similar to Immigrants from Eritrea by 3rd Grade
In terms of 3rd grade, the demographic groups most similar to Immigrants from Eritrea are Malaysian (97.0%, a difference of 0.010%), Immigrants from Grenada (97.0%, a difference of 0.020%), British West Indian (97.0%, a difference of 0.050%), Immigrants from Portugal (97.0%, a difference of 0.060%), and Immigrants from Afghanistan (97.0%, a difference of 0.060%).
| Demographics | Rating | Rank | 3rd Grade |
| Immigrants | West Indies | 0.0 /100 | #288 | Tragic 97.1% |
| Immigrants | Thailand | 0.0 /100 | #289 | Tragic 97.1% |
| Immigrants | Portugal | 0.0 /100 | #290 | Tragic 97.0% |
| Immigrants | Afghanistan | 0.0 /100 | #291 | Tragic 97.0% |
| British West Indians | 0.0 /100 | #292 | Tragic 97.0% |
| Immigrants | Grenada | 0.0 /100 | #293 | Tragic 97.0% |
| Malaysians | 0.0 /100 | #294 | Tragic 97.0% |
| Immigrants | Eritrea | 0.0 /100 | #295 | Tragic 97.0% |
| Immigrants | Immigrants | 0.0 /100 | #296 | Tragic 96.9% |
| Haitians | 0.0 /100 | #297 | Tragic 96.9% |
| Immigrants | Dominica | 0.0 /100 | #298 | Tragic 96.9% |
| Somalis | 0.0 /100 | #299 | Tragic 96.8% |
| Immigrants | South Eastern Asia | 0.0 /100 | #300 | Tragic 96.8% |
| Immigrants | Cuba | 0.0 /100 | #301 | Tragic 96.8% |
| Immigrants | Somalia | 0.0 /100 | #302 | Tragic 96.8% |