Carpatho Rusyn vs Belizean 1st Grade
COMPARE
Carpatho Rusyn
Belizean
1st Grade
1st Grade Comparison
Carpatho Rusyns
Belizeans
98.6%
1ST GRADE
100.0/ 100
METRIC RATING
13th/ 347
METRIC RANK
96.9%
1ST GRADE
0.0/ 100
METRIC RATING
306th/ 347
METRIC RANK
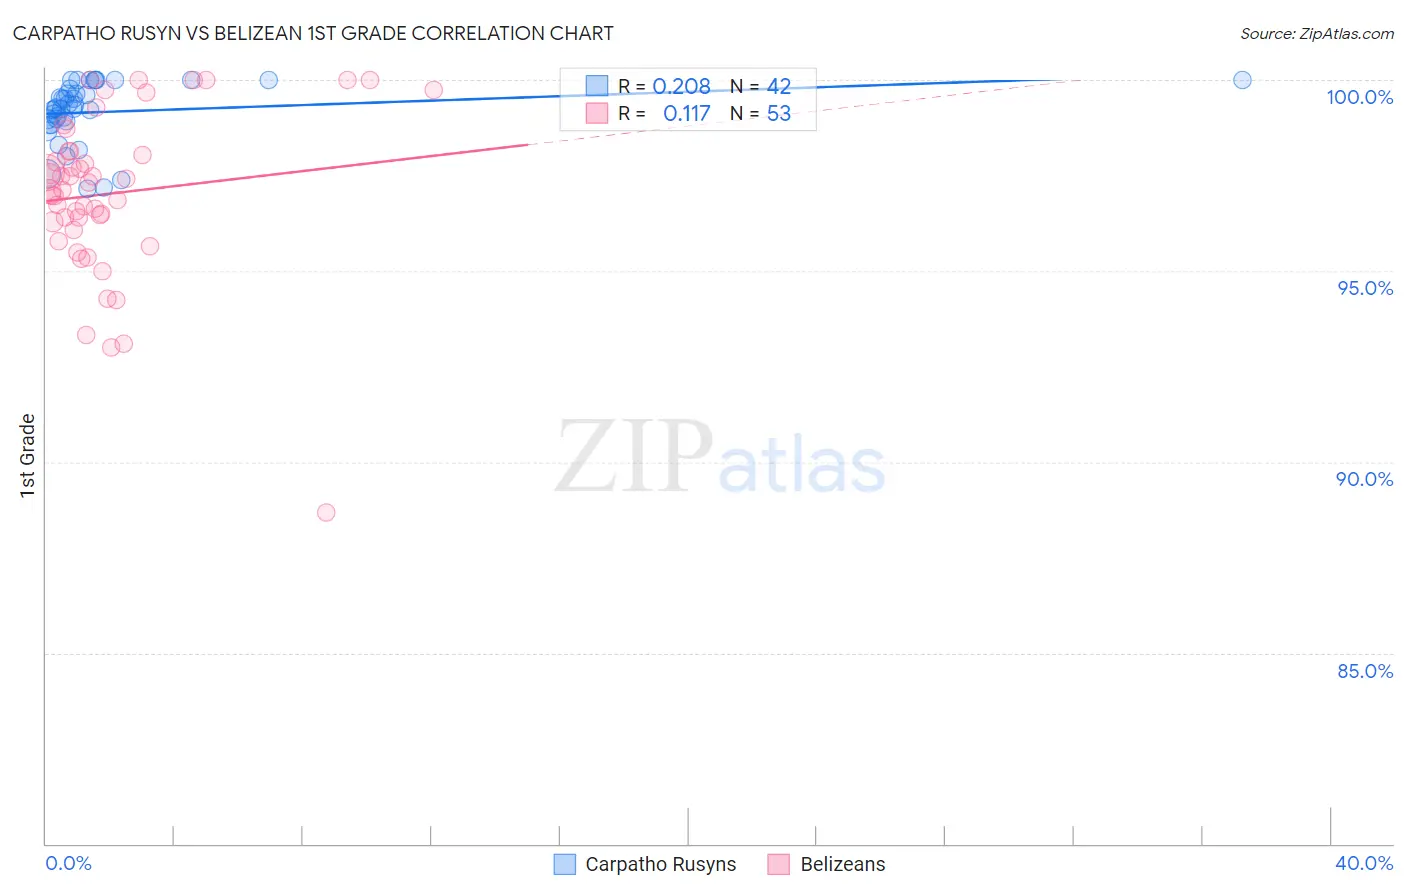
Carpatho Rusyn vs Belizean 1st Grade Correlation Chart
The statistical analysis conducted on geographies consisting of 58,871,690 people shows a weak positive correlation between the proportion of Carpatho Rusyns and percentage of population with at least 1st grade education in the United States with a correlation coefficient (R) of 0.208 and weighted average of 98.6%. Similarly, the statistical analysis conducted on geographies consisting of 144,224,236 people shows a poor positive correlation between the proportion of Belizeans and percentage of population with at least 1st grade education in the United States with a correlation coefficient (R) of 0.117 and weighted average of 96.9%, a difference of 1.8%.
1st Grade Correlation Summary
| Measurement | Carpatho Rusyn | Belizean |
| Minimum | 97.2% | 88.7% |
| Maximum | 100.0% | 100.0% |
| Range | 2.8% | 11.3% |
| Mean | 99.2% | 97.0% |
| Median | 99.3% | 97.1% |
| Interquartile 25% (IQ1) | 98.9% | 96.2% |
| Interquartile 75% (IQ3) | 99.8% | 98.1% |
| Interquartile Range (IQR) | 0.86% | 2.0% |
| Standard Deviation (Sample) | 0.80% | 2.2% |
| Standard Deviation (Population) | 0.79% | 2.1% |
Similar Demographics by 1st Grade
Demographics Similar to Carpatho Rusyns by 1st Grade
In terms of 1st grade, the demographic groups most similar to Carpatho Rusyns are English (98.6%, a difference of 0.0%), Slovene (98.7%, a difference of 0.010%), Swedish (98.6%, a difference of 0.010%), Tlingit-Haida (98.7%, a difference of 0.020%), and Aleut (98.6%, a difference of 0.030%).
| Demographics | Rating | Rank | 1st Grade |
| Alaskan Athabascans | 100.0 /100 | #6 | Exceptional 98.8% |
| Alaska Natives | 100.0 /100 | #7 | Exceptional 98.7% |
| Norwegians | 100.0 /100 | #8 | Exceptional 98.7% |
| Slovaks | 100.0 /100 | #9 | Exceptional 98.7% |
| Germans | 100.0 /100 | #10 | Exceptional 98.7% |
| Tlingit-Haida | 100.0 /100 | #11 | Exceptional 98.7% |
| Slovenes | 100.0 /100 | #12 | Exceptional 98.7% |
| Carpatho Rusyns | 100.0 /100 | #13 | Exceptional 98.6% |
| English | 100.0 /100 | #14 | Exceptional 98.6% |
| Swedes | 100.0 /100 | #15 | Exceptional 98.6% |
| Aleuts | 100.0 /100 | #16 | Exceptional 98.6% |
| Scottish | 100.0 /100 | #17 | Exceptional 98.6% |
| Dutch | 100.0 /100 | #18 | Exceptional 98.6% |
| Irish | 100.0 /100 | #19 | Exceptional 98.6% |
| Sioux | 100.0 /100 | #20 | Exceptional 98.6% |
Demographics Similar to Belizeans by 1st Grade
In terms of 1st grade, the demographic groups most similar to Belizeans are Immigrants from Somalia (96.9%, a difference of 0.010%), Hispanic or Latino (96.9%, a difference of 0.010%), Immigrants from Haiti (96.9%, a difference of 0.010%), Immigrants from the Azores (96.9%, a difference of 0.020%), and Sri Lankan (96.9%, a difference of 0.040%).
| Demographics | Rating | Rank | 1st Grade |
| Immigrants | Cuba | 0.0 /100 | #299 | Tragic 97.1% |
| Haitians | 0.0 /100 | #300 | Tragic 97.1% |
| Immigrants | South Eastern Asia | 0.0 /100 | #301 | Tragic 97.1% |
| Immigrants | Caribbean | 0.0 /100 | #302 | Tragic 97.0% |
| Somalis | 0.0 /100 | #303 | Tragic 97.0% |
| Nicaraguans | 0.0 /100 | #304 | Tragic 97.0% |
| Ecuadorians | 0.0 /100 | #305 | Tragic 97.0% |
| Belizeans | 0.0 /100 | #306 | Tragic 96.9% |
| Immigrants | Somalia | 0.0 /100 | #307 | Tragic 96.9% |
| Hispanics or Latinos | 0.0 /100 | #308 | Tragic 96.9% |
| Immigrants | Haiti | 0.0 /100 | #309 | Tragic 96.9% |
| Immigrants | Azores | 0.0 /100 | #310 | Tragic 96.9% |
| Sri Lankans | 0.0 /100 | #311 | Tragic 96.9% |
| Cape Verdeans | 0.0 /100 | #312 | Tragic 96.9% |
| Guyanese | 0.0 /100 | #313 | Tragic 96.9% |