Immigrants from Trinidad and Tobago vs Immigrants from Brazil Kindergarten
COMPARE
Immigrants from Trinidad and Tobago
Immigrants from Brazil
Kindergarten
Kindergarten Comparison
Immigrants from Trinidad and Tobago
Immigrants from Brazil
97.3%
KINDERGARTEN
0.0/ 100
METRIC RATING
284th/ 347
METRIC RANK
98.0%
KINDERGARTEN
50.0/ 100
METRIC RATING
174th/ 347
METRIC RANK
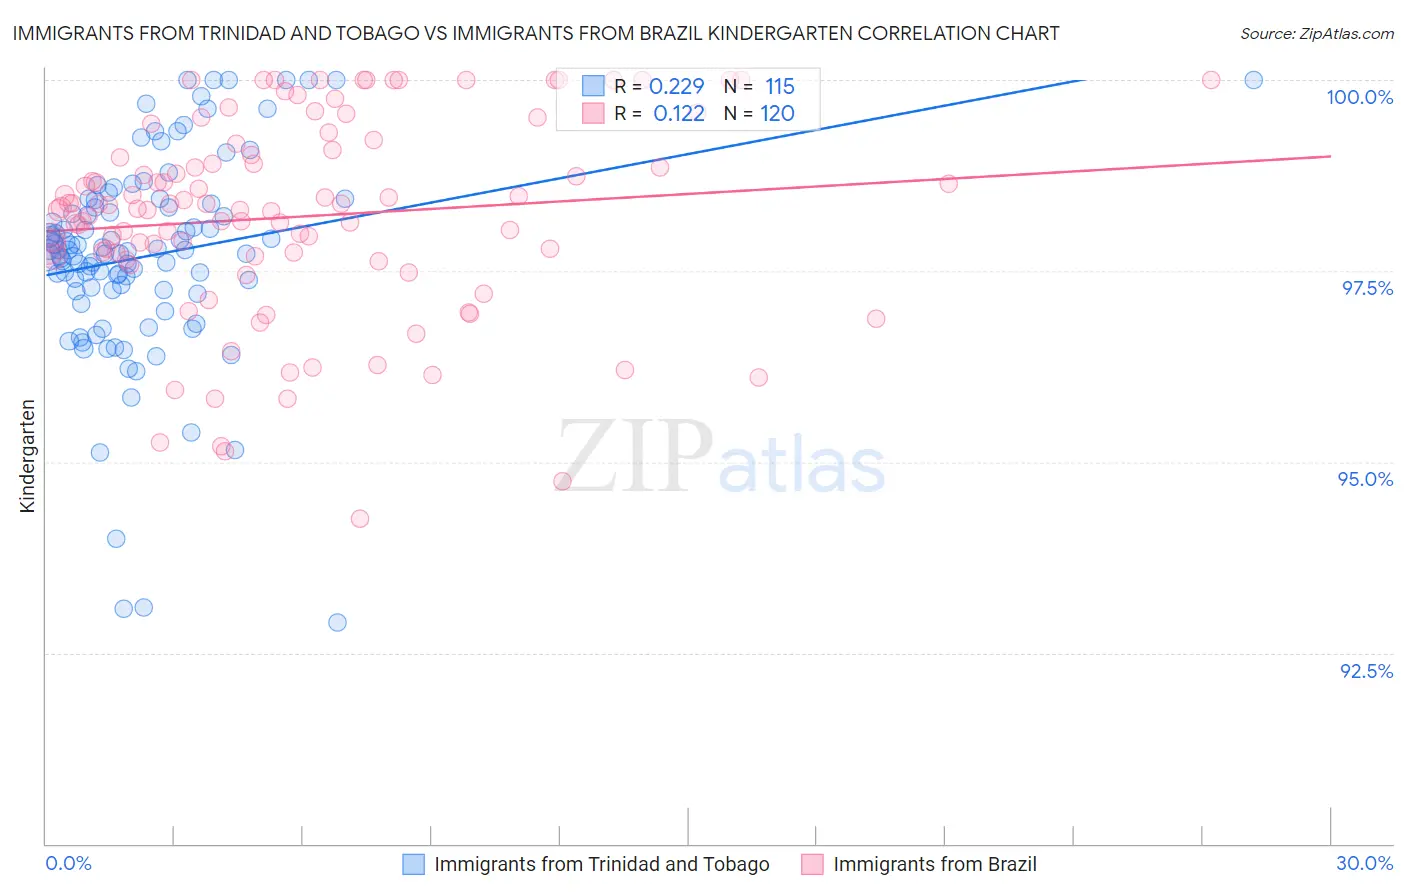
Immigrants from Trinidad and Tobago vs Immigrants from Brazil Kindergarten Correlation Chart
The statistical analysis conducted on geographies consisting of 223,545,304 people shows a weak positive correlation between the proportion of Immigrants from Trinidad and Tobago and percentage of population with at least kindergarten education in the United States with a correlation coefficient (R) of 0.229 and weighted average of 97.3%. Similarly, the statistical analysis conducted on geographies consisting of 343,021,580 people shows a poor positive correlation between the proportion of Immigrants from Brazil and percentage of population with at least kindergarten education in the United States with a correlation coefficient (R) of 0.122 and weighted average of 98.0%, a difference of 0.63%.
Kindergarten Correlation Summary
| Measurement | Immigrants from Trinidad and Tobago | Immigrants from Brazil |
| Minimum | 92.9% | 94.3% |
| Maximum | 100.0% | 100.0% |
| Range | 7.1% | 5.7% |
| Mean | 97.7% | 98.2% |
| Median | 97.8% | 98.3% |
| Interquartile 25% (IQ1) | 97.2% | 97.7% |
| Interquartile 75% (IQ3) | 98.4% | 99.1% |
| Interquartile Range (IQR) | 1.1% | 1.4% |
| Standard Deviation (Sample) | 1.3% | 1.3% |
| Standard Deviation (Population) | 1.3% | 1.3% |
Similar Demographics by Kindergarten
Demographics Similar to Immigrants from Trinidad and Tobago by Kindergarten
In terms of kindergarten, the demographic groups most similar to Immigrants from Trinidad and Tobago are Immigrants from West Indies (97.3%, a difference of 0.010%), Immigrants from Portugal (97.3%, a difference of 0.010%), Immigrants from Barbados (97.3%, a difference of 0.020%), Immigrants from Hong Kong (97.3%, a difference of 0.020%), and Immigrants from Thailand (97.3%, a difference of 0.030%).
| Demographics | Rating | Rank | Kindergarten |
| Immigrants | Western Africa | 0.1 /100 | #277 | Tragic 97.4% |
| Immigrants | Uzbekistan | 0.1 /100 | #278 | Tragic 97.4% |
| Immigrants | Ghana | 0.1 /100 | #279 | Tragic 97.4% |
| Barbadians | 0.1 /100 | #280 | Tragic 97.4% |
| Trinidadians and Tobagonians | 0.1 /100 | #281 | Tragic 97.4% |
| Afghans | 0.0 /100 | #282 | Tragic 97.4% |
| Immigrants | West Indies | 0.0 /100 | #283 | Tragic 97.3% |
| Immigrants | Trinidad and Tobago | 0.0 /100 | #284 | Tragic 97.3% |
| Immigrants | Portugal | 0.0 /100 | #285 | Tragic 97.3% |
| Immigrants | Barbados | 0.0 /100 | #286 | Tragic 97.3% |
| Immigrants | Hong Kong | 0.0 /100 | #287 | Tragic 97.3% |
| Immigrants | Thailand | 0.0 /100 | #288 | Tragic 97.3% |
| Immigrants | Afghanistan | 0.0 /100 | #289 | Tragic 97.3% |
| Immigrants | St. Vincent and the Grenadines | 0.0 /100 | #290 | Tragic 97.3% |
| Houma | 0.0 /100 | #291 | Tragic 97.3% |
Demographics Similar to Immigrants from Brazil by Kindergarten
In terms of kindergarten, the demographic groups most similar to Immigrants from Brazil are Native/Alaskan (98.0%, a difference of 0.0%), Kenyan (98.0%, a difference of 0.0%), Immigrants from Sri Lanka (97.9%, a difference of 0.0%), Albanian (97.9%, a difference of 0.0%), and Immigrants from Spain (98.0%, a difference of 0.010%).
| Demographics | Rating | Rank | Kindergarten |
| Immigrants | Spain | 54.6 /100 | #167 | Average 98.0% |
| Navajo | 54.4 /100 | #168 | Average 98.0% |
| Immigrants | Korea | 54.1 /100 | #169 | Average 98.0% |
| Bermudans | 54.0 /100 | #170 | Average 98.0% |
| Immigrants | Jordan | 54.0 /100 | #171 | Average 98.0% |
| Natives/Alaskans | 51.0 /100 | #172 | Average 98.0% |
| Kenyans | 51.0 /100 | #173 | Average 98.0% |
| Immigrants | Brazil | 50.0 /100 | #174 | Average 98.0% |
| Immigrants | Sri Lanka | 49.6 /100 | #175 | Average 97.9% |
| Albanians | 48.5 /100 | #176 | Average 97.9% |
| Immigrants | Venezuela | 47.9 /100 | #177 | Average 97.9% |
| Brazilians | 47.6 /100 | #178 | Average 97.9% |
| Argentineans | 46.8 /100 | #179 | Average 97.9% |
| Immigrants | Bosnia and Herzegovina | 46.7 /100 | #180 | Average 97.9% |
| Portuguese | 43.5 /100 | #181 | Average 97.9% |