Immigrants from Trinidad and Tobago vs Venezuelan 6th Grade
COMPARE
Immigrants from Trinidad and Tobago
Venezuelan
6th Grade
6th Grade Comparison
Immigrants from Trinidad and Tobago
Venezuelans
96.2%
6TH GRADE
0.0/ 100
METRIC RATING
287th/ 347
METRIC RANK
97.0%
6TH GRADE
50.0/ 100
METRIC RATING
174th/ 347
METRIC RANK
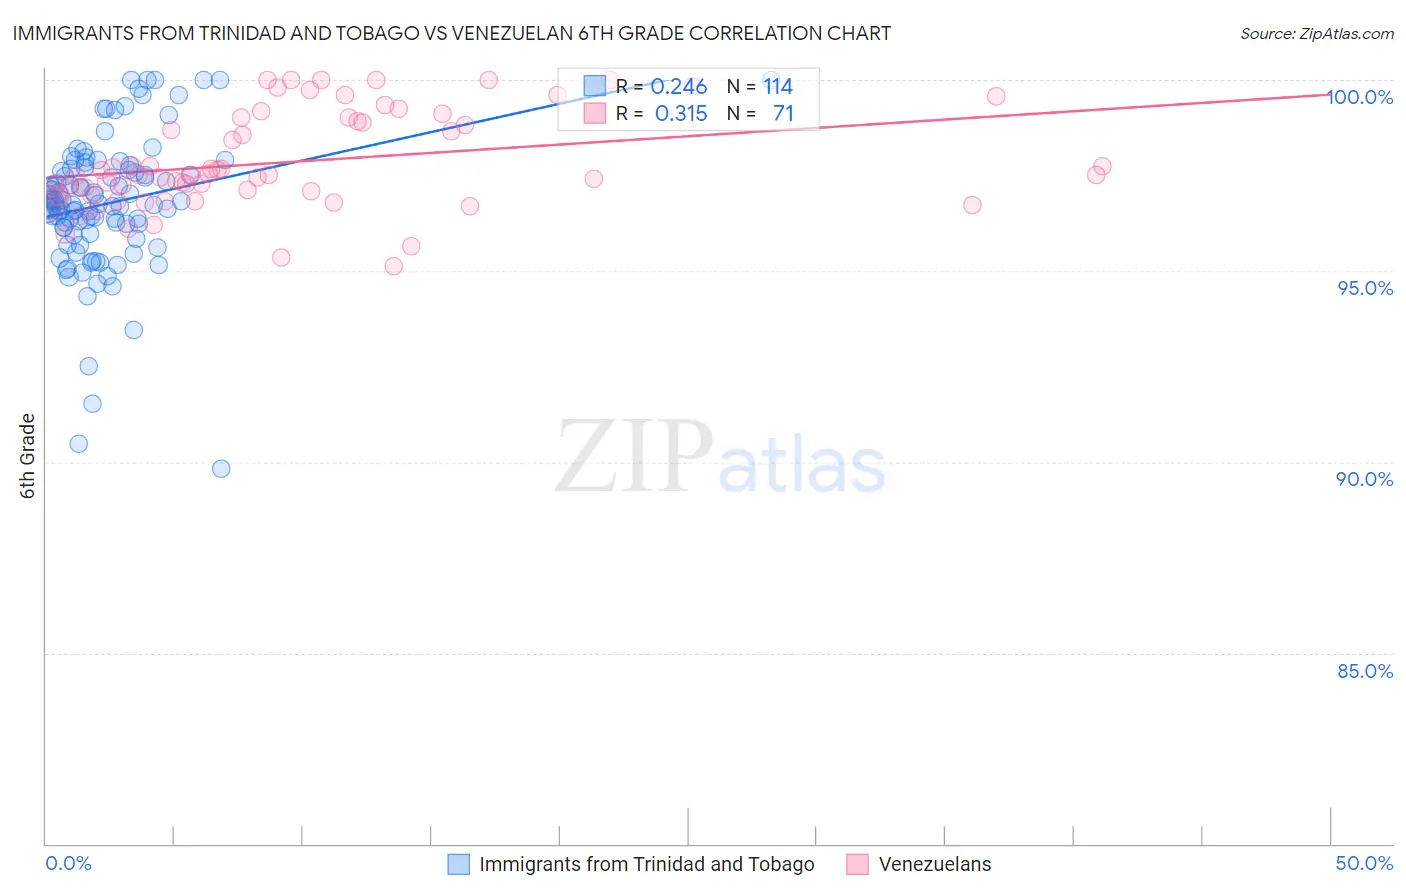
Immigrants from Trinidad and Tobago vs Venezuelan 6th Grade Correlation Chart
The statistical analysis conducted on geographies consisting of 223,526,834 people shows a weak positive correlation between the proportion of Immigrants from Trinidad and Tobago and percentage of population with at least 6th grade education in the United States with a correlation coefficient (R) of 0.246 and weighted average of 96.2%. Similarly, the statistical analysis conducted on geographies consisting of 306,323,638 people shows a mild positive correlation between the proportion of Venezuelans and percentage of population with at least 6th grade education in the United States with a correlation coefficient (R) of 0.315 and weighted average of 97.0%, a difference of 0.91%.
6th Grade Correlation Summary
| Measurement | Immigrants from Trinidad and Tobago | Venezuelan |
| Minimum | 89.8% | 95.1% |
| Maximum | 100.0% | 100.0% |
| Range | 10.2% | 4.9% |
| Mean | 96.8% | 97.9% |
| Median | 96.7% | 97.5% |
| Interquartile 25% (IQ1) | 96.1% | 97.0% |
| Interquartile 75% (IQ3) | 97.6% | 99.0% |
| Interquartile Range (IQR) | 1.5% | 2.0% |
| Standard Deviation (Sample) | 1.8% | 1.3% |
| Standard Deviation (Population) | 1.8% | 1.3% |
Similar Demographics by 6th Grade
Demographics Similar to Immigrants from Trinidad and Tobago by 6th Grade
In terms of 6th grade, the demographic groups most similar to Immigrants from Trinidad and Tobago are Barbadian (96.2%, a difference of 0.010%), Malaysian (96.2%, a difference of 0.010%), Immigrants from Eritrea (96.1%, a difference of 0.030%), Somali (96.2%, a difference of 0.040%), and Fijian (96.2%, a difference of 0.050%).
| Demographics | Rating | Rank | 6th Grade |
| Immigrants | Afghanistan | 0.1 /100 | #280 | Tragic 96.2% |
| Trinidadians and Tobagonians | 0.1 /100 | #281 | Tragic 96.2% |
| Houma | 0.1 /100 | #282 | Tragic 96.2% |
| Cubans | 0.1 /100 | #283 | Tragic 96.2% |
| Fijians | 0.1 /100 | #284 | Tragic 96.2% |
| Somalis | 0.1 /100 | #285 | Tragic 96.2% |
| Barbadians | 0.0 /100 | #286 | Tragic 96.2% |
| Immigrants | Trinidad and Tobago | 0.0 /100 | #287 | Tragic 96.2% |
| Malaysians | 0.0 /100 | #288 | Tragic 96.2% |
| Immigrants | Eritrea | 0.0 /100 | #289 | Tragic 96.1% |
| Immigrants | Somalia | 0.0 /100 | #290 | Tragic 96.1% |
| Immigrants | St. Vincent and the Grenadines | 0.0 /100 | #291 | Tragic 96.1% |
| Immigrants | Barbados | 0.0 /100 | #292 | Tragic 96.1% |
| Immigrants | West Indies | 0.0 /100 | #293 | Tragic 96.1% |
| British West Indians | 0.0 /100 | #294 | Tragic 96.0% |
Demographics Similar to Venezuelans by 6th Grade
In terms of 6th grade, the demographic groups most similar to Venezuelans are Egyptian (97.1%, a difference of 0.0%), Arab (97.0%, a difference of 0.0%), Bermudan (97.1%, a difference of 0.010%), Chilean (97.1%, a difference of 0.010%), and Immigrants from Sri Lanka (97.1%, a difference of 0.010%).
| Demographics | Rating | Rank | 6th Grade |
| Apache | 53.6 /100 | #167 | Average 97.1% |
| Immigrants | Taiwan | 53.5 /100 | #168 | Average 97.1% |
| Bermudans | 52.6 /100 | #169 | Average 97.1% |
| Chileans | 52.1 /100 | #170 | Average 97.1% |
| Immigrants | Sri Lanka | 51.7 /100 | #171 | Average 97.1% |
| Egyptians | 50.9 /100 | #172 | Average 97.1% |
| Arabs | 50.1 /100 | #173 | Average 97.0% |
| Venezuelans | 50.0 /100 | #174 | Average 97.0% |
| Immigrants | Kazakhstan | 47.3 /100 | #175 | Average 97.0% |
| Immigrants | Micronesia | 47.1 /100 | #176 | Average 97.0% |
| Mongolians | 46.7 /100 | #177 | Average 97.0% |
| Pakistanis | 46.0 /100 | #178 | Average 97.0% |
| Immigrants | Kenya | 45.3 /100 | #179 | Average 97.0% |
| Immigrants | Spain | 39.9 /100 | #180 | Fair 97.0% |
| Comanche | 37.9 /100 | #181 | Fair 97.0% |