Immigrants from Taiwan vs Ugandan Child Poverty Among Boys Under 16
COMPARE
Immigrants from Taiwan
Ugandan
Child Poverty Among Boys Under 16
Child Poverty Among Boys Under 16 Comparison
Immigrants from Taiwan
Ugandans
11.0%
CHILD POVERTY AMONG BOYS UNDER 16
100.0/ 100
METRIC RATING
2nd/ 347
METRIC RANK
17.3%
CHILD POVERTY AMONG BOYS UNDER 16
12.5/ 100
METRIC RATING
204th/ 347
METRIC RANK
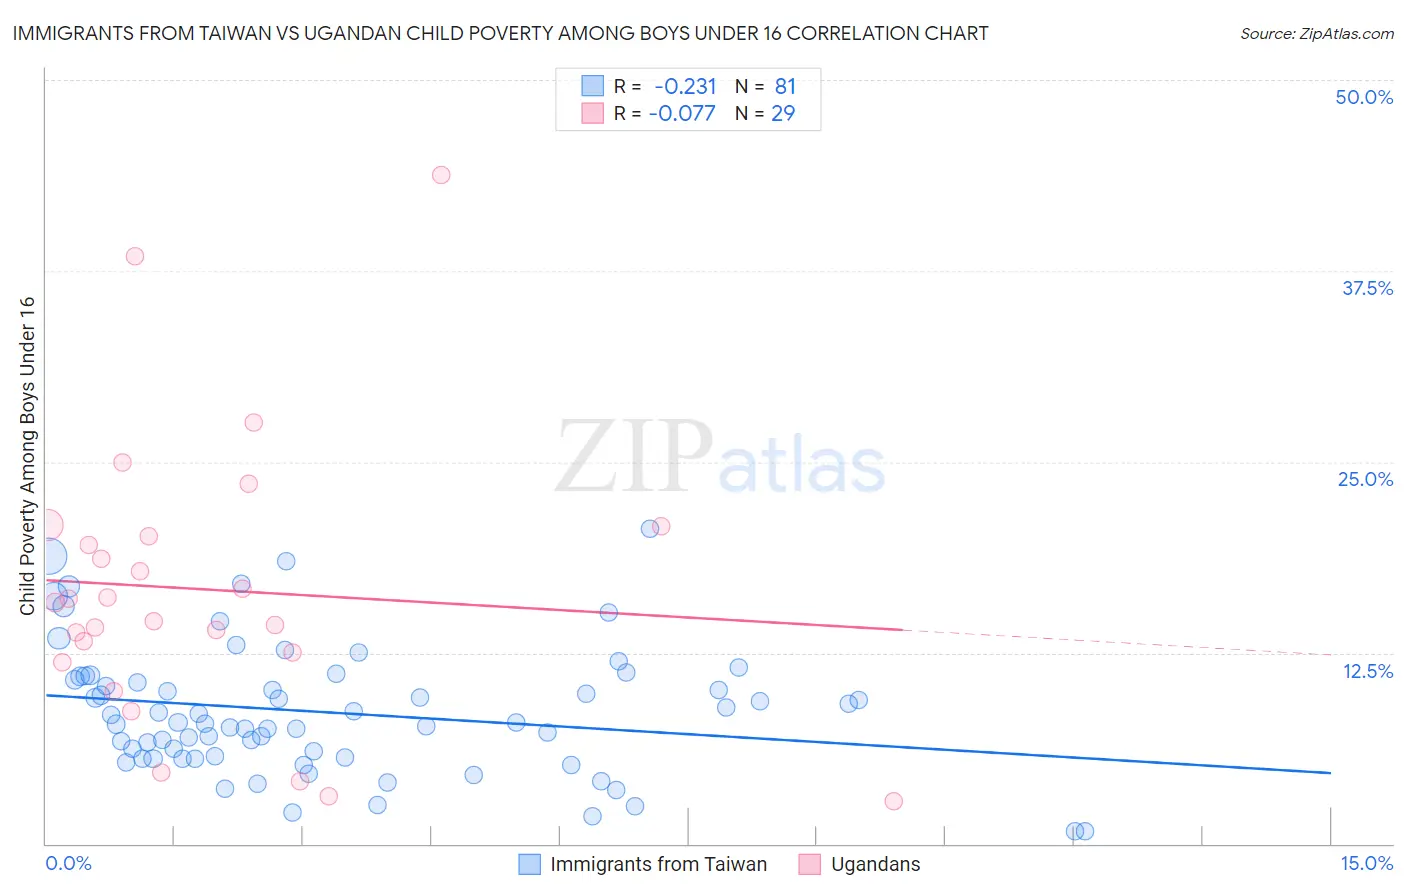
Immigrants from Taiwan vs Ugandan Child Poverty Among Boys Under 16 Correlation Chart
The statistical analysis conducted on geographies consisting of 293,651,008 people shows a weak negative correlation between the proportion of Immigrants from Taiwan and poverty level among boys under the age of 16 in the United States with a correlation coefficient (R) of -0.231 and weighted average of 11.0%. Similarly, the statistical analysis conducted on geographies consisting of 93,708,162 people shows a slight negative correlation between the proportion of Ugandans and poverty level among boys under the age of 16 in the United States with a correlation coefficient (R) of -0.077 and weighted average of 17.3%, a difference of 57.1%.
Child Poverty Among Boys Under 16 Correlation Summary
| Measurement | Immigrants from Taiwan | Ugandan |
| Minimum | 0.83% | 2.8% |
| Maximum | 20.6% | 43.7% |
| Range | 19.8% | 41.0% |
| Mean | 8.6% | 16.6% |
| Median | 7.9% | 15.8% |
| Interquartile 25% (IQ1) | 5.6% | 12.2% |
| Interquartile 75% (IQ3) | 10.9% | 20.5% |
| Interquartile Range (IQR) | 5.2% | 8.3% |
| Standard Deviation (Sample) | 4.2% | 9.2% |
| Standard Deviation (Population) | 4.1% | 9.1% |
Similar Demographics by Child Poverty Among Boys Under 16
Demographics Similar to Immigrants from Taiwan by Child Poverty Among Boys Under 16
In terms of child poverty among boys under 16, the demographic groups most similar to Immigrants from Taiwan are Filipino (11.1%, a difference of 0.78%), Immigrants from India (10.9%, a difference of 1.5%), Thai (11.7%, a difference of 5.9%), Chinese (11.9%, a difference of 7.6%), and Immigrants from Hong Kong (12.3%, a difference of 11.1%).
| Demographics | Rating | Rank | Child Poverty Among Boys Under 16 |
| Immigrants | India | 100.0 /100 | #1 | Exceptional 10.9% |
| Immigrants | Taiwan | 100.0 /100 | #2 | Exceptional 11.0% |
| Filipinos | 100.0 /100 | #3 | Exceptional 11.1% |
| Thais | 100.0 /100 | #4 | Exceptional 11.7% |
| Chinese | 100.0 /100 | #5 | Exceptional 11.9% |
| Immigrants | Hong Kong | 100.0 /100 | #6 | Exceptional 12.3% |
| Iranians | 100.0 /100 | #7 | Exceptional 12.4% |
| Immigrants | Singapore | 100.0 /100 | #8 | Exceptional 12.5% |
| Immigrants | Iran | 100.0 /100 | #9 | Exceptional 12.5% |
| Bhutanese | 100.0 /100 | #10 | Exceptional 12.6% |
| Immigrants | South Central Asia | 100.0 /100 | #11 | Exceptional 12.7% |
| Burmese | 99.9 /100 | #12 | Exceptional 13.0% |
| Immigrants | Korea | 99.9 /100 | #13 | Exceptional 13.0% |
| Immigrants | Ireland | 99.9 /100 | #14 | Exceptional 13.1% |
| Immigrants | Japan | 99.9 /100 | #15 | Exceptional 13.1% |
Demographics Similar to Ugandans by Child Poverty Among Boys Under 16
In terms of child poverty among boys under 16, the demographic groups most similar to Ugandans are Immigrants from Uzbekistan (17.3%, a difference of 0.20%), Immigrants from Sierra Leone (17.3%, a difference of 0.22%), Immigrants from Afghanistan (17.3%, a difference of 0.28%), Immigrants from Portugal (17.4%, a difference of 0.33%), and German Russian (17.4%, a difference of 0.39%).
| Demographics | Rating | Rank | Child Poverty Among Boys Under 16 |
| Immigrants | Kenya | 20.1 /100 | #197 | Fair 17.1% |
| Immigrants | Cameroon | 19.0 /100 | #198 | Poor 17.1% |
| Delaware | 18.8 /100 | #199 | Poor 17.1% |
| Immigrants | Uruguay | 16.9 /100 | #200 | Poor 17.2% |
| Immigrants | Afghanistan | 13.7 /100 | #201 | Poor 17.3% |
| Immigrants | Sierra Leone | 13.4 /100 | #202 | Poor 17.3% |
| Immigrants | Uzbekistan | 13.3 /100 | #203 | Poor 17.3% |
| Ugandans | 12.5 /100 | #204 | Poor 17.3% |
| Immigrants | Portugal | 11.2 /100 | #205 | Poor 17.4% |
| German Russians | 10.9 /100 | #206 | Poor 17.4% |
| Immigrants | Thailand | 8.2 /100 | #207 | Tragic 17.5% |
| Malaysians | 7.6 /100 | #208 | Tragic 17.6% |
| Alaskan Athabascans | 7.3 /100 | #209 | Tragic 17.6% |
| Immigrants | Armenia | 6.8 /100 | #210 | Tragic 17.6% |
| Immigrants | Immigrants | 6.7 /100 | #211 | Tragic 17.6% |