Immigrants from Switzerland vs Honduran Professional Degree
COMPARE
Immigrants from Switzerland
Honduran
Professional Degree
Professional Degree Comparison
Immigrants from Switzerland
Hondurans
7.1%
PROFESSIONAL DEGREE
100.0/ 100
METRIC RATING
8th/ 347
METRIC RANK
3.5%
PROFESSIONAL DEGREE
0.3/ 100
METRIC RATING
285th/ 347
METRIC RANK
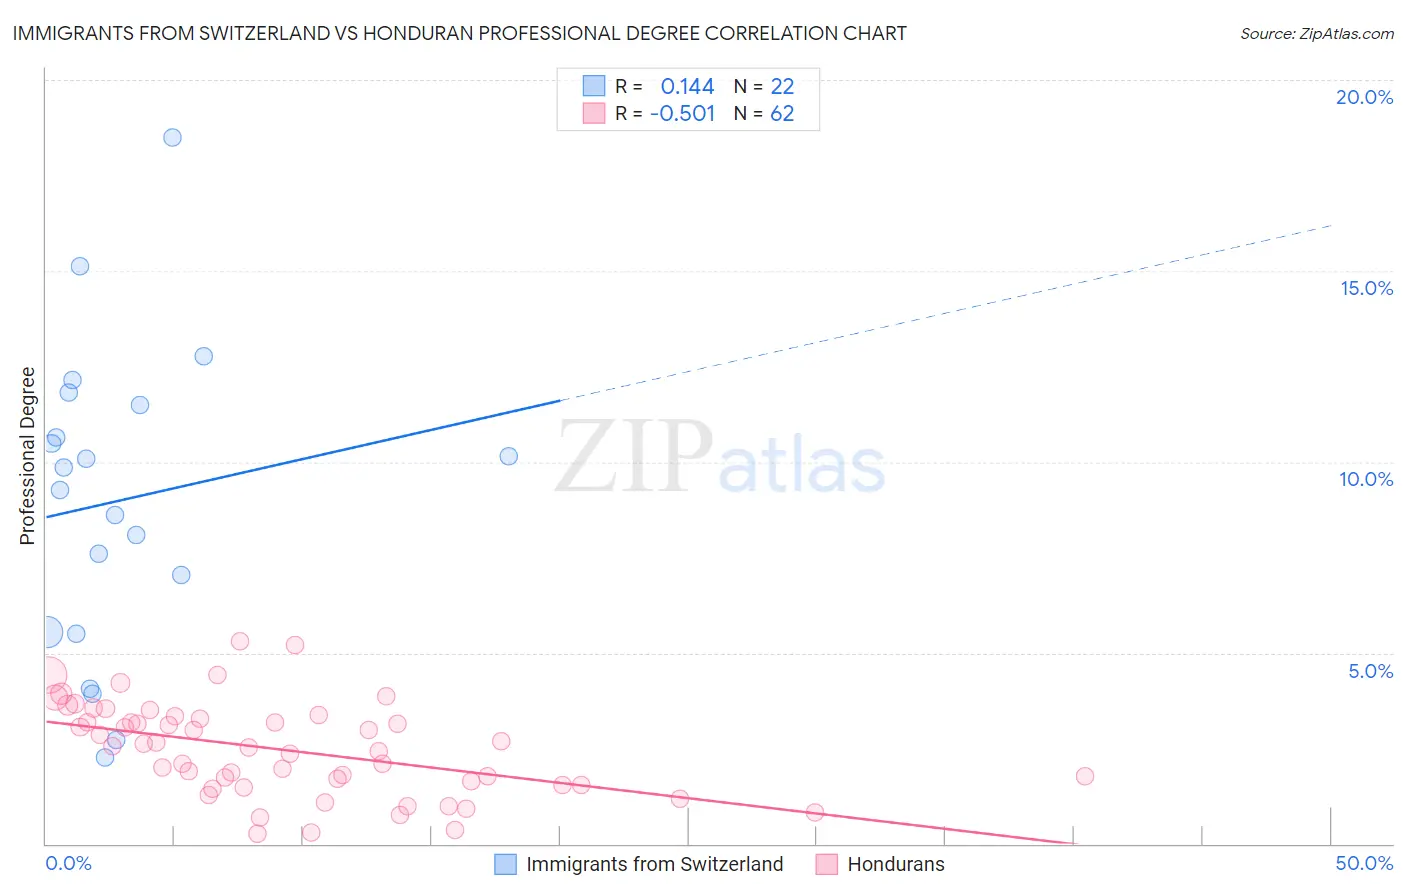
Immigrants from Switzerland vs Honduran Professional Degree Correlation Chart
The statistical analysis conducted on geographies consisting of 148,038,589 people shows a poor positive correlation between the proportion of Immigrants from Switzerland and percentage of population with at least professional degree education in the United States with a correlation coefficient (R) of 0.144 and weighted average of 7.1%. Similarly, the statistical analysis conducted on geographies consisting of 356,762,123 people shows a substantial negative correlation between the proportion of Hondurans and percentage of population with at least professional degree education in the United States with a correlation coefficient (R) of -0.501 and weighted average of 3.5%, a difference of 102.9%.
Professional Degree Correlation Summary
| Measurement | Immigrants from Switzerland | Honduran |
| Minimum | 2.3% | 0.27% |
| Maximum | 18.5% | 5.3% |
| Range | 16.2% | 5.0% |
| Mean | 9.0% | 2.5% |
| Median | 9.6% | 2.5% |
| Interquartile 25% (IQ1) | 5.5% | 1.5% |
| Interquartile 75% (IQ3) | 11.5% | 3.3% |
| Interquartile Range (IQR) | 5.9% | 1.7% |
| Standard Deviation (Sample) | 4.0% | 1.2% |
| Standard Deviation (Population) | 3.9% | 1.2% |
Similar Demographics by Professional Degree
Demographics Similar to Immigrants from Switzerland by Professional Degree
In terms of professional degree, the demographic groups most similar to Immigrants from Switzerland are Eastern European (7.1%, a difference of 0.14%), Immigrants from Taiwan (7.1%, a difference of 0.19%), Immigrants from Belgium (7.0%, a difference of 1.9%), Cypriot (6.9%, a difference of 2.1%), and Israeli (6.9%, a difference of 2.2%).
| Demographics | Rating | Rank | Professional Degree |
| Immigrants | Israel | 100.0 /100 | #1 | Exceptional 7.9% |
| Immigrants | Singapore | 100.0 /100 | #2 | Exceptional 7.7% |
| Iranians | 100.0 /100 | #3 | Exceptional 7.6% |
| Filipinos | 100.0 /100 | #4 | Exceptional 7.6% |
| Immigrants | Iran | 100.0 /100 | #5 | Exceptional 7.3% |
| Okinawans | 100.0 /100 | #6 | Exceptional 7.3% |
| Eastern Europeans | 100.0 /100 | #7 | Exceptional 7.1% |
| Immigrants | Switzerland | 100.0 /100 | #8 | Exceptional 7.1% |
| Immigrants | Taiwan | 100.0 /100 | #9 | Exceptional 7.1% |
| Immigrants | Belgium | 100.0 /100 | #10 | Exceptional 7.0% |
| Cypriots | 100.0 /100 | #11 | Exceptional 6.9% |
| Israelis | 100.0 /100 | #12 | Exceptional 6.9% |
| Immigrants | Australia | 100.0 /100 | #13 | Exceptional 6.9% |
| Immigrants | France | 100.0 /100 | #14 | Exceptional 6.8% |
| Immigrants | China | 100.0 /100 | #15 | Exceptional 6.7% |
Demographics Similar to Hondurans by Professional Degree
In terms of professional degree, the demographic groups most similar to Hondurans are Haitian (3.5%, a difference of 0.34%), Immigrants from El Salvador (3.5%, a difference of 0.44%), Blackfeet (3.5%, a difference of 0.49%), Guatemalan (3.5%, a difference of 0.66%), and Chippewa (3.5%, a difference of 0.67%).
| Demographics | Rating | Rank | Professional Degree |
| Japanese | 0.5 /100 | #278 | Tragic 3.5% |
| Immigrants | Portugal | 0.5 /100 | #279 | Tragic 3.5% |
| Dominicans | 0.5 /100 | #280 | Tragic 3.5% |
| Apache | 0.5 /100 | #281 | Tragic 3.5% |
| Immigrants | Caribbean | 0.5 /100 | #282 | Tragic 3.5% |
| Comanche | 0.4 /100 | #283 | Tragic 3.5% |
| Salvadorans | 0.4 /100 | #284 | Tragic 3.5% |
| Hondurans | 0.3 /100 | #285 | Tragic 3.5% |
| Haitians | 0.3 /100 | #286 | Tragic 3.5% |
| Immigrants | El Salvador | 0.3 /100 | #287 | Tragic 3.5% |
| Blackfeet | 0.3 /100 | #288 | Tragic 3.5% |
| Guatemalans | 0.3 /100 | #289 | Tragic 3.5% |
| Chippewa | 0.3 /100 | #290 | Tragic 3.5% |
| Alaska Natives | 0.3 /100 | #291 | Tragic 3.5% |
| Immigrants | Belize | 0.3 /100 | #292 | Tragic 3.5% |