Immigrants from Sweden vs Hawaiian Doctorate Degree
COMPARE
Immigrants from Sweden
Hawaiian
Doctorate Degree
Doctorate Degree Comparison
Immigrants from Sweden
Hawaiians
2.9%
DOCTORATE DEGREE
100.0/ 100
METRIC RATING
13th/ 347
METRIC RANK
1.5%
DOCTORATE DEGREE
0.4/ 100
METRIC RATING
278th/ 347
METRIC RANK
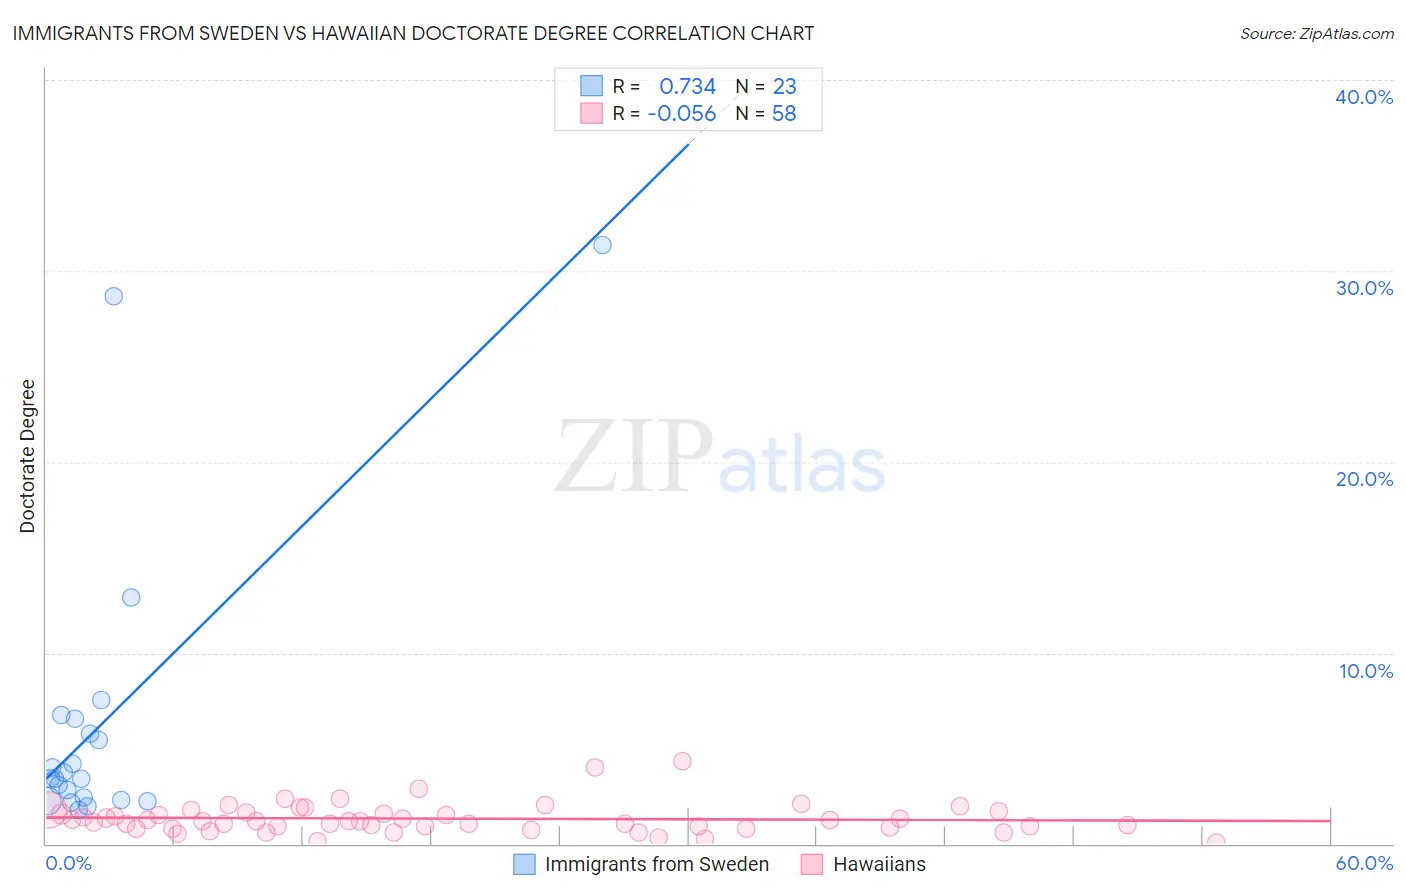
Immigrants from Sweden vs Hawaiian Doctorate Degree Correlation Chart
The statistical analysis conducted on geographies consisting of 164,460,690 people shows a strong positive correlation between the proportion of Immigrants from Sweden and percentage of population with at least doctorate degree education in the United States with a correlation coefficient (R) of 0.734 and weighted average of 2.9%. Similarly, the statistical analysis conducted on geographies consisting of 323,773,151 people shows a slight negative correlation between the proportion of Hawaiians and percentage of population with at least doctorate degree education in the United States with a correlation coefficient (R) of -0.056 and weighted average of 1.5%, a difference of 95.9%.
Doctorate Degree Correlation Summary
| Measurement | Immigrants from Sweden | Hawaiian |
| Minimum | 1.7% | 0.092% |
| Maximum | 31.4% | 4.3% |
| Range | 29.6% | 4.2% |
| Mean | 6.4% | 1.3% |
| Median | 3.4% | 1.2% |
| Interquartile 25% (IQ1) | 2.3% | 0.88% |
| Interquartile 75% (IQ3) | 6.6% | 1.6% |
| Interquartile Range (IQR) | 4.3% | 0.73% |
| Standard Deviation (Sample) | 7.9% | 0.79% |
| Standard Deviation (Population) | 7.7% | 0.78% |
Similar Demographics by Doctorate Degree
Demographics Similar to Immigrants from Sweden by Doctorate Degree
In terms of doctorate degree, the demographic groups most similar to Immigrants from Sweden are Immigrants from France (2.9%, a difference of 0.050%), Immigrants from Belgium (2.9%, a difference of 0.94%), Immigrants from India (2.8%, a difference of 1.2%), Eastern European (2.8%, a difference of 1.5%), and Indian (Asian) (2.9%, a difference of 1.6%).
| Demographics | Rating | Rank | Doctorate Degree |
| Immigrants | Switzerland | 100.0 /100 | #6 | Exceptional 3.1% |
| Immigrants | China | 100.0 /100 | #7 | Exceptional 3.1% |
| Immigrants | Israel | 100.0 /100 | #8 | Exceptional 3.0% |
| Immigrants | Iran | 100.0 /100 | #9 | Exceptional 3.0% |
| Immigrants | Eastern Asia | 100.0 /100 | #10 | Exceptional 3.0% |
| Indians (Asian) | 100.0 /100 | #11 | Exceptional 2.9% |
| Immigrants | Belgium | 100.0 /100 | #12 | Exceptional 2.9% |
| Immigrants | Sweden | 100.0 /100 | #13 | Exceptional 2.9% |
| Immigrants | France | 100.0 /100 | #14 | Exceptional 2.9% |
| Immigrants | India | 100.0 /100 | #15 | Exceptional 2.8% |
| Eastern Europeans | 100.0 /100 | #16 | Exceptional 2.8% |
| Immigrants | Australia | 100.0 /100 | #17 | Exceptional 2.8% |
| Immigrants | Sri Lanka | 100.0 /100 | #18 | Exceptional 2.8% |
| Immigrants | Japan | 100.0 /100 | #19 | Exceptional 2.8% |
| Immigrants | Hong Kong | 100.0 /100 | #20 | Exceptional 2.8% |
Demographics Similar to Hawaiians by Doctorate Degree
In terms of doctorate degree, the demographic groups most similar to Hawaiians are Bahamian (1.5%, a difference of 0.060%), Marshallese (1.5%, a difference of 0.22%), Ecuadorian (1.5%, a difference of 0.23%), Tohono O'odham (1.5%, a difference of 0.30%), and British West Indian (1.5%, a difference of 0.35%).
| Demographics | Rating | Rank | Doctorate Degree |
| Immigrants | Trinidad and Tobago | 0.5 /100 | #271 | Tragic 1.5% |
| Immigrants | Barbados | 0.4 /100 | #272 | Tragic 1.5% |
| Sioux | 0.4 /100 | #273 | Tragic 1.5% |
| Yaqui | 0.4 /100 | #274 | Tragic 1.5% |
| Aleuts | 0.4 /100 | #275 | Tragic 1.5% |
| Paiute | 0.4 /100 | #276 | Tragic 1.5% |
| Bahamians | 0.4 /100 | #277 | Tragic 1.5% |
| Hawaiians | 0.4 /100 | #278 | Tragic 1.5% |
| Marshallese | 0.4 /100 | #279 | Tragic 1.5% |
| Ecuadorians | 0.4 /100 | #280 | Tragic 1.5% |
| Tohono O'odham | 0.4 /100 | #281 | Tragic 1.5% |
| British West Indians | 0.3 /100 | #282 | Tragic 1.5% |
| Central Americans | 0.3 /100 | #283 | Tragic 1.5% |
| Jamaicans | 0.3 /100 | #284 | Tragic 1.5% |
| Malaysians | 0.3 /100 | #285 | Tragic 1.5% |