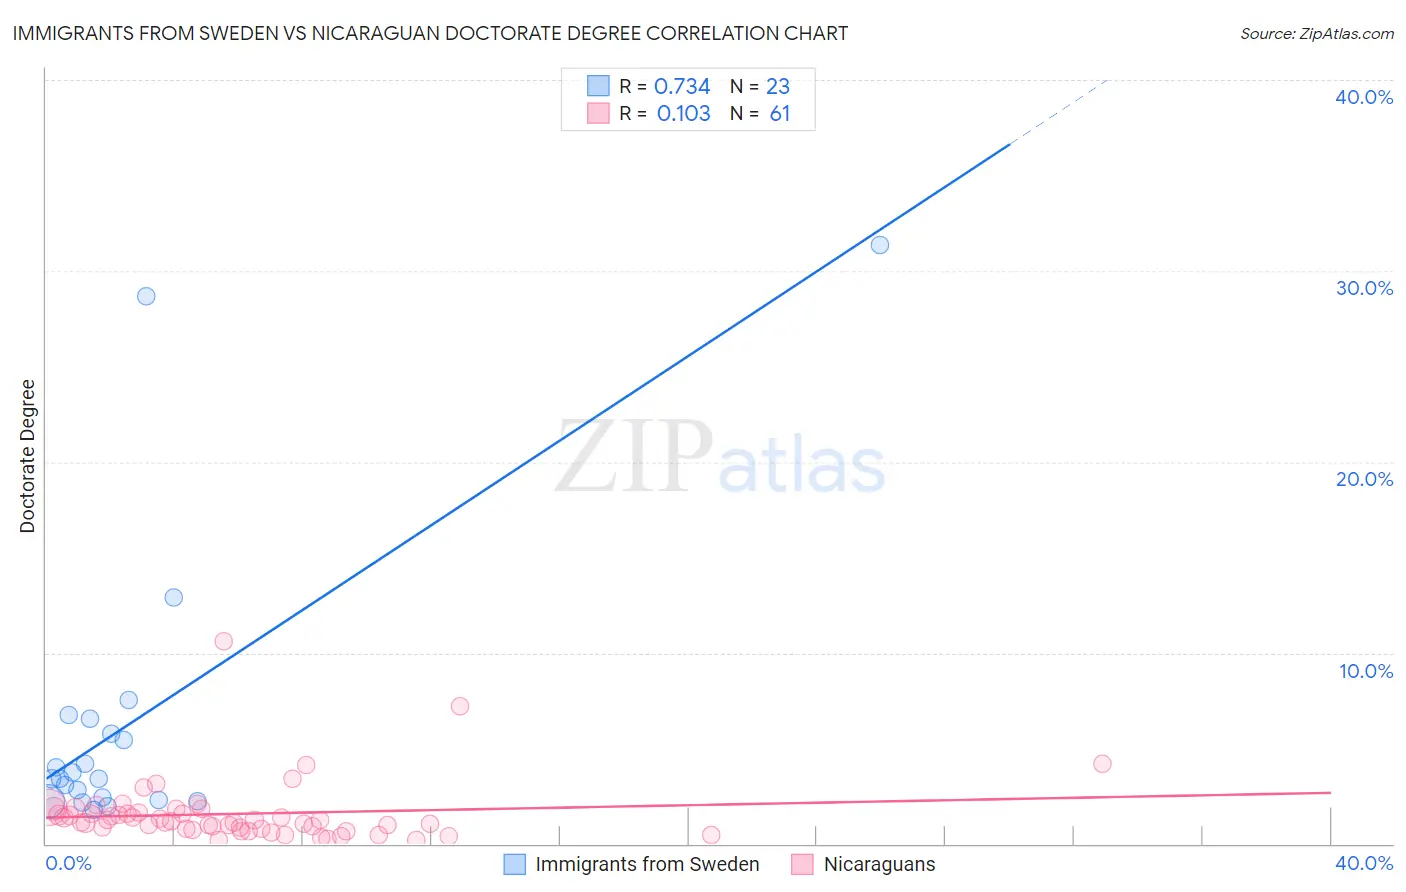
Immigrants from Sweden vs Nicaraguan Doctorate Degree
COMPARE
Immigrants from Sweden
Nicaraguan
Doctorate Degree
Doctorate Degree Comparison
Immigrants from Sweden
Nicaraguans
2.9%
DOCTORATE DEGREE
100.0/ 100
METRIC RATING
13th/ 347
METRIC RANK
1.5%
DOCTORATE DEGREE
0.6/ 100
METRIC RATING
265th/ 347
METRIC RANK
Immigrants from Sweden vs Nicaraguan Doctorate Degree Correlation Chart
The statistical analysis conducted on geographies consisting of 164,460,690 people shows a strong positive correlation between the proportion of Immigrants from Sweden and percentage of population with at least doctorate degree education in the United States with a correlation coefficient (R) of 0.734 and weighted average of 2.9%. Similarly, the statistical analysis conducted on geographies consisting of 283,726,433 people shows a poor positive correlation between the proportion of Nicaraguans and percentage of population with at least doctorate degree education in the United States with a correlation coefficient (R) of 0.103 and weighted average of 1.5%, a difference of 90.9%.
Doctorate Degree Correlation Summary
| Measurement | Immigrants from Sweden | Nicaraguan |
| Minimum | 1.7% | 0.20% |
| Maximum | 31.4% | 10.6% |
| Range | 29.6% | 10.4% |
| Mean | 6.4% | 1.6% |
| Median | 3.4% | 1.2% |
| Interquartile 25% (IQ1) | 2.3% | 0.78% |
| Interquartile 75% (IQ3) | 6.6% | 1.7% |
| Interquartile Range (IQR) | 4.3% | 0.94% |
| Standard Deviation (Sample) | 7.9% | 1.6% |
| Standard Deviation (Population) | 7.7% | 1.6% |
Similar Demographics by Doctorate Degree
Demographics Similar to Immigrants from Sweden by Doctorate Degree
In terms of doctorate degree, the demographic groups most similar to Immigrants from Sweden are Immigrants from France (2.9%, a difference of 0.050%), Immigrants from Belgium (2.9%, a difference of 0.94%), Immigrants from India (2.8%, a difference of 1.2%), Eastern European (2.8%, a difference of 1.5%), and Indian (Asian) (2.9%, a difference of 1.6%).
| Demographics | Rating | Rank | Doctorate Degree |
| Immigrants | Switzerland | 100.0 /100 | #6 | Exceptional 3.1% |
| Immigrants | China | 100.0 /100 | #7 | Exceptional 3.1% |
| Immigrants | Israel | 100.0 /100 | #8 | Exceptional 3.0% |
| Immigrants | Iran | 100.0 /100 | #9 | Exceptional 3.0% |
| Immigrants | Eastern Asia | 100.0 /100 | #10 | Exceptional 3.0% |
| Indians (Asian) | 100.0 /100 | #11 | Exceptional 2.9% |
| Immigrants | Belgium | 100.0 /100 | #12 | Exceptional 2.9% |
| Immigrants | Sweden | 100.0 /100 | #13 | Exceptional 2.9% |
| Immigrants | France | 100.0 /100 | #14 | Exceptional 2.9% |
| Immigrants | India | 100.0 /100 | #15 | Exceptional 2.8% |
| Eastern Europeans | 100.0 /100 | #16 | Exceptional 2.8% |
| Immigrants | Australia | 100.0 /100 | #17 | Exceptional 2.8% |
| Immigrants | Sri Lanka | 100.0 /100 | #18 | Exceptional 2.8% |
| Immigrants | Japan | 100.0 /100 | #19 | Exceptional 2.8% |
| Immigrants | Hong Kong | 100.0 /100 | #20 | Exceptional 2.8% |
Demographics Similar to Nicaraguans by Doctorate Degree
In terms of doctorate degree, the demographic groups most similar to Nicaraguans are Blackfeet (1.5%, a difference of 0.28%), Immigrants from Bahamas (1.5%, a difference of 0.47%), Chickasaw (1.5%, a difference of 0.64%), Immigrants from Liberia (1.5%, a difference of 0.78%), and Immigrants from Portugal (1.5%, a difference of 0.79%).
| Demographics | Rating | Rank | Doctorate Degree |
| Immigrants | West Indies | 0.9 /100 | #258 | Tragic 1.5% |
| Liberians | 0.9 /100 | #259 | Tragic 1.5% |
| Japanese | 0.9 /100 | #260 | Tragic 1.5% |
| Immigrants | Portugal | 0.8 /100 | #261 | Tragic 1.5% |
| Chickasaw | 0.7 /100 | #262 | Tragic 1.5% |
| Immigrants | Bahamas | 0.7 /100 | #263 | Tragic 1.5% |
| Blackfeet | 0.7 /100 | #264 | Tragic 1.5% |
| Nicaraguans | 0.6 /100 | #265 | Tragic 1.5% |
| Immigrants | Liberia | 0.5 /100 | #266 | Tragic 1.5% |
| Kiowa | 0.5 /100 | #267 | Tragic 1.5% |
| U.S. Virgin Islanders | 0.5 /100 | #268 | Tragic 1.5% |
| Crow | 0.5 /100 | #269 | Tragic 1.5% |
| Salvadorans | 0.5 /100 | #270 | Tragic 1.5% |
| Immigrants | Trinidad and Tobago | 0.5 /100 | #271 | Tragic 1.5% |
| Immigrants | Barbados | 0.4 /100 | #272 | Tragic 1.5% |