Immigrants from Sweden vs Kenyan Doctorate Degree
COMPARE
Immigrants from Sweden
Kenyan
Doctorate Degree
Doctorate Degree Comparison
Immigrants from Sweden
Kenyans
2.9%
DOCTORATE DEGREE
100.0/ 100
METRIC RATING
13th/ 347
METRIC RANK
1.9%
DOCTORATE DEGREE
83.6/ 100
METRIC RATING
145th/ 347
METRIC RANK
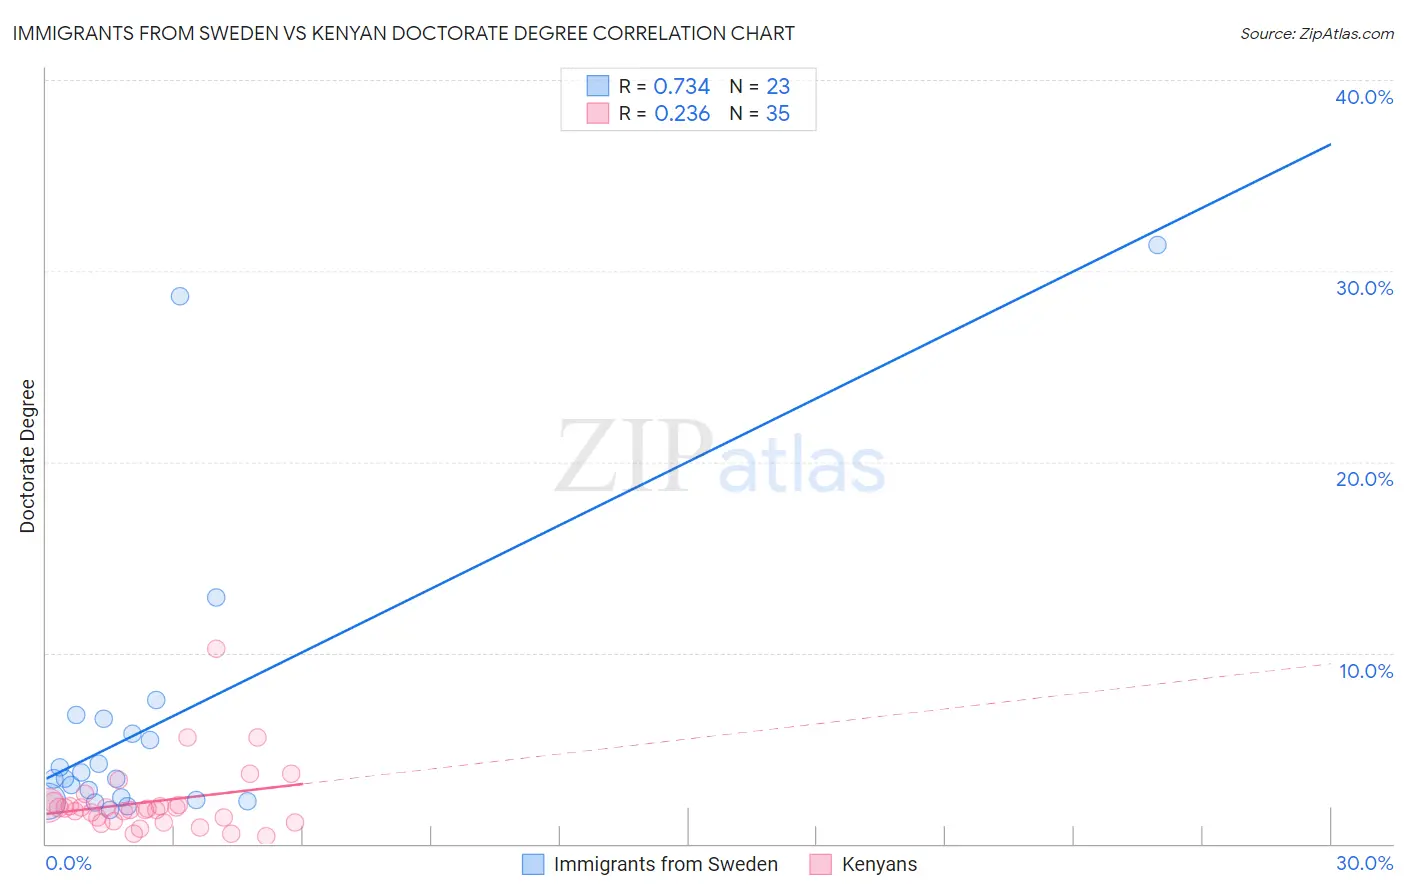
Immigrants from Sweden vs Kenyan Doctorate Degree Correlation Chart
The statistical analysis conducted on geographies consisting of 164,460,690 people shows a strong positive correlation between the proportion of Immigrants from Sweden and percentage of population with at least doctorate degree education in the United States with a correlation coefficient (R) of 0.734 and weighted average of 2.9%. Similarly, the statistical analysis conducted on geographies consisting of 167,867,619 people shows a weak positive correlation between the proportion of Kenyans and percentage of population with at least doctorate degree education in the United States with a correlation coefficient (R) of 0.236 and weighted average of 1.9%, a difference of 47.0%.
Doctorate Degree Correlation Summary
| Measurement | Immigrants from Sweden | Kenyan |
| Minimum | 1.7% | 0.37% |
| Maximum | 31.4% | 10.2% |
| Range | 29.6% | 9.9% |
| Mean | 6.4% | 2.2% |
| Median | 3.4% | 1.8% |
| Interquartile 25% (IQ1) | 2.3% | 1.2% |
| Interquartile 75% (IQ3) | 6.6% | 2.0% |
| Interquartile Range (IQR) | 4.3% | 0.83% |
| Standard Deviation (Sample) | 7.9% | 1.8% |
| Standard Deviation (Population) | 7.7% | 1.8% |
Similar Demographics by Doctorate Degree
Demographics Similar to Immigrants from Sweden by Doctorate Degree
In terms of doctorate degree, the demographic groups most similar to Immigrants from Sweden are Immigrants from France (2.9%, a difference of 0.050%), Immigrants from Belgium (2.9%, a difference of 0.94%), Immigrants from India (2.8%, a difference of 1.2%), Eastern European (2.8%, a difference of 1.5%), and Indian (Asian) (2.9%, a difference of 1.6%).
| Demographics | Rating | Rank | Doctorate Degree |
| Immigrants | Switzerland | 100.0 /100 | #6 | Exceptional 3.1% |
| Immigrants | China | 100.0 /100 | #7 | Exceptional 3.1% |
| Immigrants | Israel | 100.0 /100 | #8 | Exceptional 3.0% |
| Immigrants | Iran | 100.0 /100 | #9 | Exceptional 3.0% |
| Immigrants | Eastern Asia | 100.0 /100 | #10 | Exceptional 3.0% |
| Indians (Asian) | 100.0 /100 | #11 | Exceptional 2.9% |
| Immigrants | Belgium | 100.0 /100 | #12 | Exceptional 2.9% |
| Immigrants | Sweden | 100.0 /100 | #13 | Exceptional 2.9% |
| Immigrants | France | 100.0 /100 | #14 | Exceptional 2.9% |
| Immigrants | India | 100.0 /100 | #15 | Exceptional 2.8% |
| Eastern Europeans | 100.0 /100 | #16 | Exceptional 2.8% |
| Immigrants | Australia | 100.0 /100 | #17 | Exceptional 2.8% |
| Immigrants | Sri Lanka | 100.0 /100 | #18 | Exceptional 2.8% |
| Immigrants | Japan | 100.0 /100 | #19 | Exceptional 2.8% |
| Immigrants | Hong Kong | 100.0 /100 | #20 | Exceptional 2.8% |
Demographics Similar to Kenyans by Doctorate Degree
In terms of doctorate degree, the demographic groups most similar to Kenyans are Immigrants from Syria (1.9%, a difference of 0.020%), Immigrants from Moldova (2.0%, a difference of 0.18%), Immigrants from Senegal (1.9%, a difference of 0.27%), Sierra Leonean (2.0%, a difference of 0.39%), and Luxembourger (1.9%, a difference of 0.60%).
| Demographics | Rating | Rank | Doctorate Degree |
| Swiss | 88.0 /100 | #138 | Excellent 2.0% |
| Afghans | 87.2 /100 | #139 | Excellent 2.0% |
| Immigrants | Africa | 87.0 /100 | #140 | Excellent 2.0% |
| Senegalese | 86.7 /100 | #141 | Excellent 2.0% |
| Italians | 86.0 /100 | #142 | Excellent 2.0% |
| Sierra Leoneans | 85.1 /100 | #143 | Excellent 2.0% |
| Immigrants | Moldova | 84.3 /100 | #144 | Excellent 2.0% |
| Kenyans | 83.6 /100 | #145 | Excellent 1.9% |
| Immigrants | Syria | 83.6 /100 | #146 | Excellent 1.9% |
| Immigrants | Senegal | 82.5 /100 | #147 | Excellent 1.9% |
| Luxembourgers | 81.1 /100 | #148 | Excellent 1.9% |
| Basques | 76.9 /100 | #149 | Good 1.9% |
| English | 75.9 /100 | #150 | Good 1.9% |
| Albanians | 74.8 /100 | #151 | Good 1.9% |
| Immigrants | Kenya | 74.3 /100 | #152 | Good 1.9% |