Immigrants from Belarus vs Greek 3rd Grade
COMPARE
Immigrants from Belarus
Greek
3rd Grade
3rd Grade Comparison
Immigrants from Belarus
Greeks
97.7%
3RD GRADE
45.9/ 100
METRIC RATING
179th/ 347
METRIC RANK
98.3%
3RD GRADE
99.7/ 100
METRIC RATING
58th/ 347
METRIC RANK
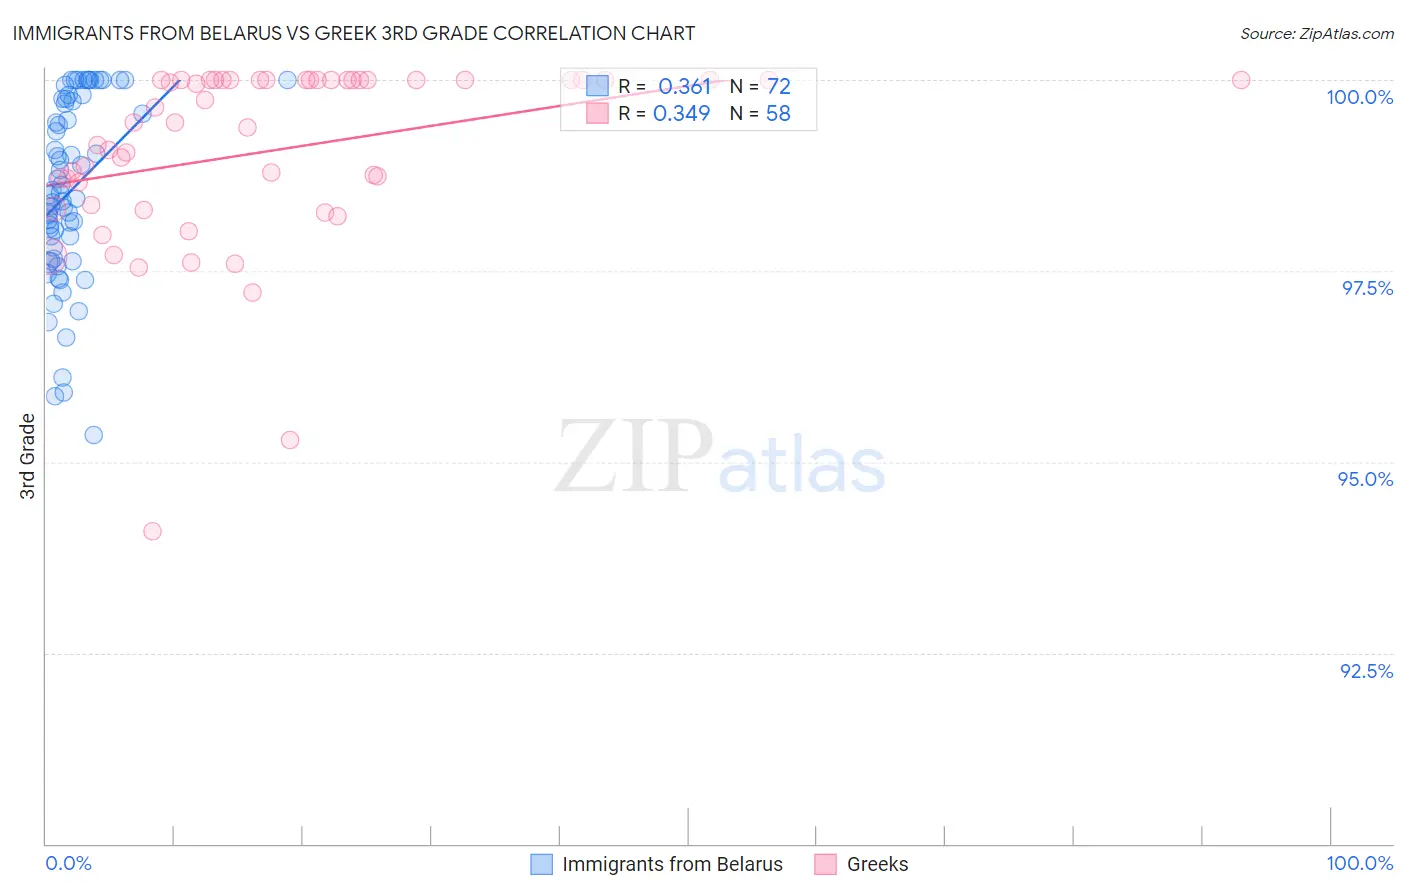
Immigrants from Belarus vs Greek 3rd Grade Correlation Chart
The statistical analysis conducted on geographies consisting of 149,993,317 people shows a mild positive correlation between the proportion of Immigrants from Belarus and percentage of population with at least 3rd grade education in the United States with a correlation coefficient (R) of 0.361 and weighted average of 97.7%. Similarly, the statistical analysis conducted on geographies consisting of 482,775,358 people shows a mild positive correlation between the proportion of Greeks and percentage of population with at least 3rd grade education in the United States with a correlation coefficient (R) of 0.349 and weighted average of 98.3%, a difference of 0.52%.
3rd Grade Correlation Summary
| Measurement | Immigrants from Belarus | Greek |
| Minimum | 95.4% | 94.1% |
| Maximum | 100.0% | 100.0% |
| Range | 4.6% | 5.9% |
| Mean | 98.6% | 99.1% |
| Median | 98.5% | 99.4% |
| Interquartile 25% (IQ1) | 97.7% | 98.4% |
| Interquartile 75% (IQ3) | 99.7% | 100.0% |
| Interquartile Range (IQR) | 2.0% | 1.6% |
| Standard Deviation (Sample) | 1.2% | 1.2% |
| Standard Deviation (Population) | 1.2% | 1.2% |
Similar Demographics by 3rd Grade
Demographics Similar to Immigrants from Belarus by 3rd Grade
In terms of 3rd grade, the demographic groups most similar to Immigrants from Belarus are Immigrants from Poland (97.8%, a difference of 0.0%), Egyptian (97.7%, a difference of 0.0%), Immigrants from Brazil (97.7%, a difference of 0.0%), Immigrants from Sri Lanka (97.7%, a difference of 0.0%), and Navajo (97.8%, a difference of 0.010%).
| Demographics | Rating | Rank | 3rd Grade |
| Spanish Americans | 51.8 /100 | #172 | Average 97.8% |
| Immigrants | Korea | 50.9 /100 | #173 | Average 97.8% |
| Navajo | 50.0 /100 | #174 | Average 97.8% |
| Immigrants | Micronesia | 47.6 /100 | #175 | Average 97.8% |
| Immigrants | Poland | 47.1 /100 | #176 | Average 97.8% |
| Egyptians | 46.6 /100 | #177 | Average 97.7% |
| Immigrants | Brazil | 46.4 /100 | #178 | Average 97.7% |
| Immigrants | Belarus | 45.9 /100 | #179 | Average 97.7% |
| Immigrants | Sri Lanka | 45.1 /100 | #180 | Average 97.7% |
| Immigrants | Venezuela | 44.4 /100 | #181 | Average 97.7% |
| Argentineans | 42.9 /100 | #182 | Average 97.7% |
| Arabs | 40.0 /100 | #183 | Fair 97.7% |
| Immigrants | Kazakhstan | 37.4 /100 | #184 | Fair 97.7% |
| Immigrants | Argentina | 37.0 /100 | #185 | Fair 97.7% |
| Portuguese | 36.2 /100 | #186 | Fair 97.7% |
Demographics Similar to Greeks by 3rd Grade
In terms of 3rd grade, the demographic groups most similar to Greeks are Slavic (98.3%, a difference of 0.0%), Maltese (98.3%, a difference of 0.0%), Creek (98.2%, a difference of 0.0%), Bulgarian (98.3%, a difference of 0.010%), and American (98.3%, a difference of 0.010%).
| Demographics | Rating | Rank | 3rd Grade |
| Australians | 99.8 /100 | #51 | Exceptional 98.3% |
| Whites/Caucasians | 99.8 /100 | #52 | Exceptional 98.3% |
| Immigrants | Scotland | 99.8 /100 | #53 | Exceptional 98.3% |
| Bulgarians | 99.8 /100 | #54 | Exceptional 98.3% |
| Americans | 99.8 /100 | #55 | Exceptional 98.3% |
| Austrians | 99.8 /100 | #56 | Exceptional 98.3% |
| Slavs | 99.7 /100 | #57 | Exceptional 98.3% |
| Greeks | 99.7 /100 | #58 | Exceptional 98.3% |
| Maltese | 99.7 /100 | #59 | Exceptional 98.3% |
| Creek | 99.7 /100 | #60 | Exceptional 98.2% |
| Pueblo | 99.7 /100 | #61 | Exceptional 98.2% |
| Immigrants | Canada | 99.7 /100 | #62 | Exceptional 98.2% |
| Immigrants | North America | 99.7 /100 | #63 | Exceptional 98.2% |
| Kiowa | 99.6 /100 | #64 | Exceptional 98.2% |
| New Zealanders | 99.6 /100 | #65 | Exceptional 98.2% |