Immigrants from Middle Africa vs Greek 3rd Grade
COMPARE
Immigrants from Middle Africa
Greek
3rd Grade
3rd Grade Comparison
Immigrants from Middle Africa
Greeks
97.4%
3RD GRADE
0.9/ 100
METRIC RATING
250th/ 347
METRIC RANK
98.3%
3RD GRADE
99.7/ 100
METRIC RATING
58th/ 347
METRIC RANK
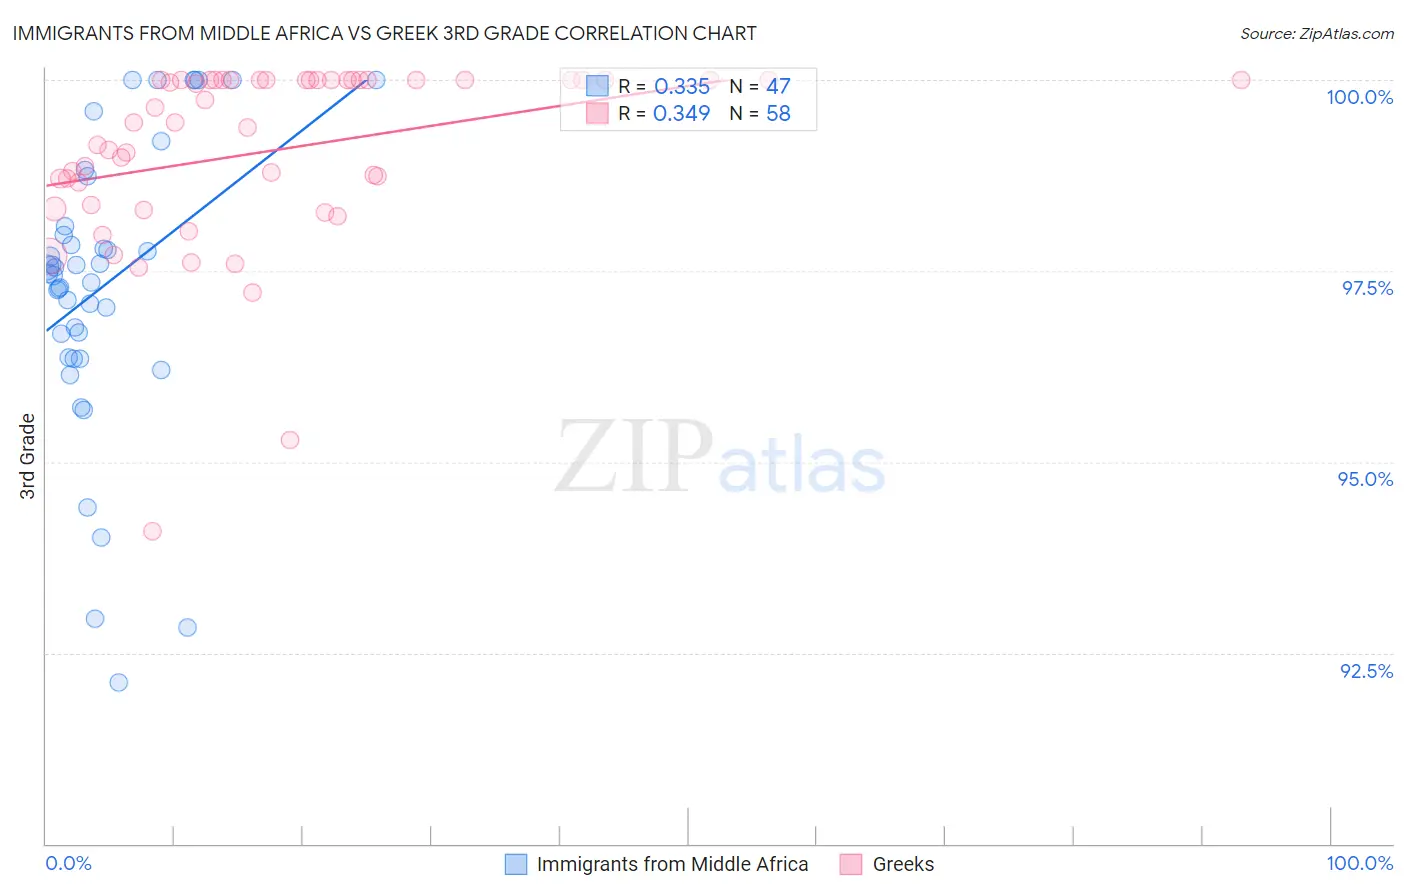
Immigrants from Middle Africa vs Greek 3rd Grade Correlation Chart
The statistical analysis conducted on geographies consisting of 202,721,852 people shows a mild positive correlation between the proportion of Immigrants from Middle Africa and percentage of population with at least 3rd grade education in the United States with a correlation coefficient (R) of 0.335 and weighted average of 97.4%. Similarly, the statistical analysis conducted on geographies consisting of 482,775,358 people shows a mild positive correlation between the proportion of Greeks and percentage of population with at least 3rd grade education in the United States with a correlation coefficient (R) of 0.349 and weighted average of 98.3%, a difference of 0.91%.
3rd Grade Correlation Summary
| Measurement | Immigrants from Middle Africa | Greek |
| Minimum | 92.1% | 94.1% |
| Maximum | 100.0% | 100.0% |
| Range | 7.9% | 5.9% |
| Mean | 97.3% | 99.1% |
| Median | 97.5% | 99.4% |
| Interquartile 25% (IQ1) | 96.4% | 98.4% |
| Interquartile 75% (IQ3) | 98.1% | 100.0% |
| Interquartile Range (IQR) | 1.7% | 1.6% |
| Standard Deviation (Sample) | 1.9% | 1.2% |
| Standard Deviation (Population) | 1.9% | 1.2% |
Similar Demographics by 3rd Grade
Demographics Similar to Immigrants from Middle Africa by 3rd Grade
In terms of 3rd grade, the demographic groups most similar to Immigrants from Middle Africa are Immigrants from Asia (97.4%, a difference of 0.0%), Immigrants from Senegal (97.4%, a difference of 0.010%), Assyrian/Chaldean/Syriac (97.4%, a difference of 0.010%), Immigrants from Eastern Africa (97.4%, a difference of 0.010%), and South American (97.4%, a difference of 0.010%).
| Demographics | Rating | Rank | 3rd Grade |
| Indians (Asian) | 1.3 /100 | #243 | Tragic 97.4% |
| Asians | 1.1 /100 | #244 | Tragic 97.4% |
| Ethiopians | 1.1 /100 | #245 | Tragic 97.4% |
| Immigrants | Senegal | 1.0 /100 | #246 | Tragic 97.4% |
| Assyrians/Chaldeans/Syriacs | 1.0 /100 | #247 | Tragic 97.4% |
| Immigrants | Eastern Africa | 0.9 /100 | #248 | Tragic 97.4% |
| South Americans | 0.9 /100 | #249 | Tragic 97.4% |
| Immigrants | Middle Africa | 0.9 /100 | #250 | Tragic 97.4% |
| Immigrants | Asia | 0.8 /100 | #251 | Tragic 97.4% |
| Peruvians | 0.8 /100 | #252 | Tragic 97.4% |
| Immigrants | Africa | 0.8 /100 | #253 | Tragic 97.4% |
| Jamaicans | 0.7 /100 | #254 | Tragic 97.4% |
| Bolivians | 0.6 /100 | #255 | Tragic 97.3% |
| Immigrants | Congo | 0.6 /100 | #256 | Tragic 97.3% |
| Immigrants | Colombia | 0.5 /100 | #257 | Tragic 97.3% |
Demographics Similar to Greeks by 3rd Grade
In terms of 3rd grade, the demographic groups most similar to Greeks are Slavic (98.3%, a difference of 0.0%), Maltese (98.3%, a difference of 0.0%), Creek (98.2%, a difference of 0.0%), Bulgarian (98.3%, a difference of 0.010%), and American (98.3%, a difference of 0.010%).
| Demographics | Rating | Rank | 3rd Grade |
| Australians | 99.8 /100 | #51 | Exceptional 98.3% |
| Whites/Caucasians | 99.8 /100 | #52 | Exceptional 98.3% |
| Immigrants | Scotland | 99.8 /100 | #53 | Exceptional 98.3% |
| Bulgarians | 99.8 /100 | #54 | Exceptional 98.3% |
| Americans | 99.8 /100 | #55 | Exceptional 98.3% |
| Austrians | 99.8 /100 | #56 | Exceptional 98.3% |
| Slavs | 99.7 /100 | #57 | Exceptional 98.3% |
| Greeks | 99.7 /100 | #58 | Exceptional 98.3% |
| Maltese | 99.7 /100 | #59 | Exceptional 98.3% |
| Creek | 99.7 /100 | #60 | Exceptional 98.2% |
| Pueblo | 99.7 /100 | #61 | Exceptional 98.2% |
| Immigrants | Canada | 99.7 /100 | #62 | Exceptional 98.2% |
| Immigrants | North America | 99.7 /100 | #63 | Exceptional 98.2% |
| Kiowa | 99.6 /100 | #64 | Exceptional 98.2% |
| New Zealanders | 99.6 /100 | #65 | Exceptional 98.2% |