Immigrants from Sudan vs Crow 4th Grade
COMPARE
Immigrants from Sudan
Crow
4th Grade
4th Grade Comparison
Immigrants from Sudan
Crow
97.2%
4TH GRADE
5.0/ 100
METRIC RATING
223rd/ 347
METRIC RANK
99.6%
4TH GRADE
100.0/ 100
METRIC RATING
1st/ 347
METRIC RANK
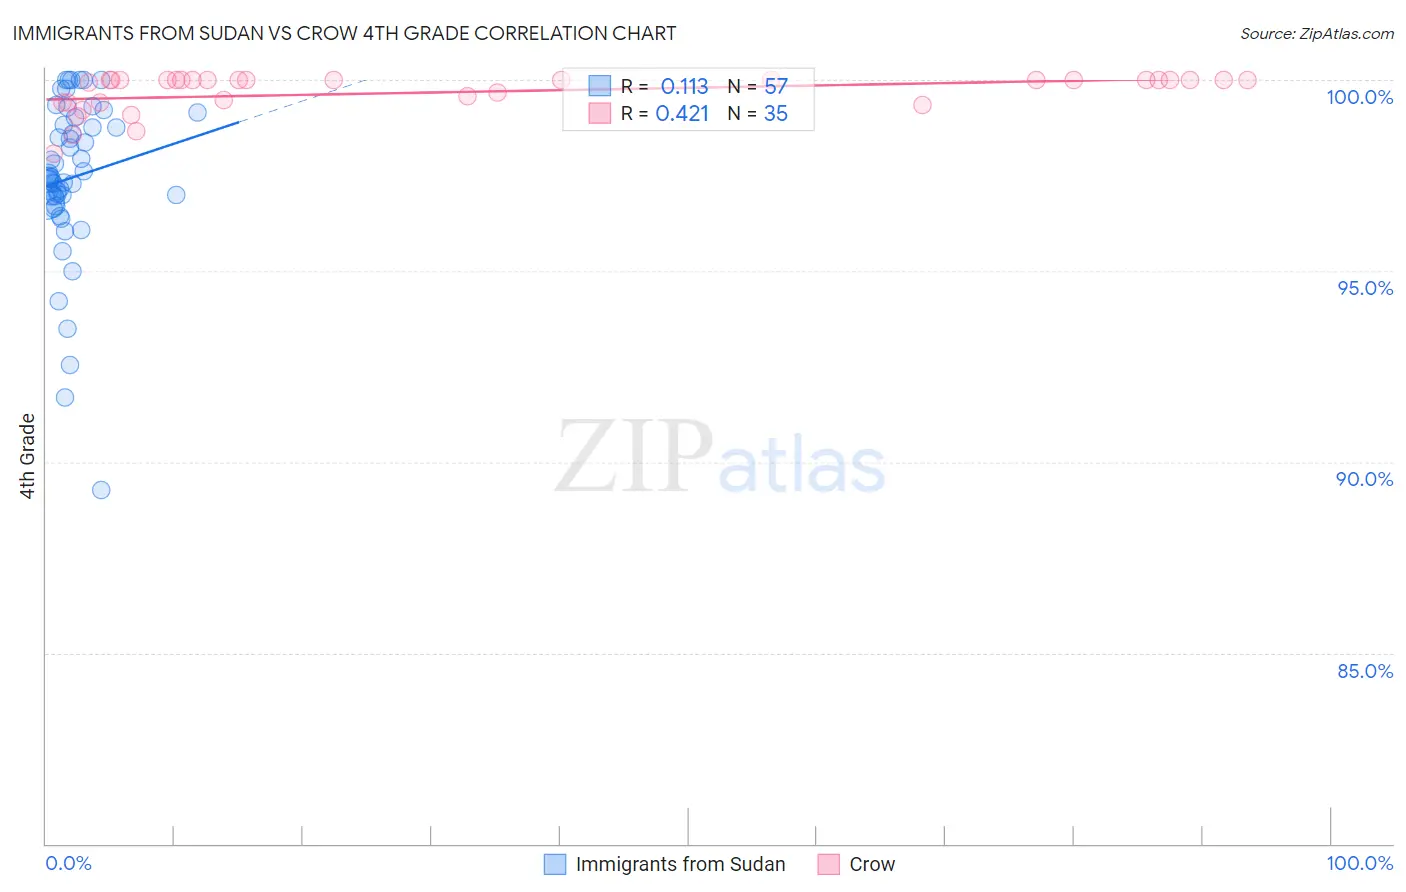
Immigrants from Sudan vs Crow 4th Grade Correlation Chart
The statistical analysis conducted on geographies consisting of 118,959,807 people shows a poor positive correlation between the proportion of Immigrants from Sudan and percentage of population with at least 4th grade education in the United States with a correlation coefficient (R) of 0.113 and weighted average of 97.2%. Similarly, the statistical analysis conducted on geographies consisting of 665,246 people shows a moderate positive correlation between the proportion of Crow and percentage of population with at least 4th grade education in the United States with a correlation coefficient (R) of 0.421 and weighted average of 99.6%, a difference of 2.4%.
4th Grade Correlation Summary
| Measurement | Immigrants from Sudan | Crow |
| Minimum | 89.3% | 98.1% |
| Maximum | 100.0% | 100.0% |
| Range | 10.7% | 1.9% |
| Mean | 97.4% | 99.7% |
| Median | 97.4% | 100.0% |
| Interquartile 25% (IQ1) | 96.9% | 99.4% |
| Interquartile 75% (IQ3) | 98.9% | 100.0% |
| Interquartile Range (IQR) | 2.0% | 0.60% |
| Standard Deviation (Sample) | 2.1% | 0.50% |
| Standard Deviation (Population) | 2.1% | 0.49% |
Similar Demographics by 4th Grade
Demographics Similar to Immigrants from Sudan by 4th Grade
In terms of 4th grade, the demographic groups most similar to Immigrants from Sudan are Immigrants from Lebanon (97.3%, a difference of 0.0%), Immigrants from Syria (97.2%, a difference of 0.0%), Tongan (97.3%, a difference of 0.010%), South American Indian (97.3%, a difference of 0.010%), and Immigrants from Panama (97.3%, a difference of 0.010%).
| Demographics | Rating | Rank | 4th Grade |
| Samoans | 6.8 /100 | #216 | Tragic 97.3% |
| Sierra Leoneans | 6.5 /100 | #217 | Tragic 97.3% |
| Iraqis | 6.3 /100 | #218 | Tragic 97.3% |
| Tongans | 5.8 /100 | #219 | Tragic 97.3% |
| South American Indians | 5.5 /100 | #220 | Tragic 97.3% |
| Immigrants | Panama | 5.4 /100 | #221 | Tragic 97.3% |
| Immigrants | Lebanon | 5.1 /100 | #222 | Tragic 97.3% |
| Immigrants | Sudan | 5.0 /100 | #223 | Tragic 97.2% |
| Immigrants | Syria | 5.0 /100 | #224 | Tragic 97.2% |
| Immigrants | Iraq | 4.6 /100 | #225 | Tragic 97.2% |
| Bahamians | 3.8 /100 | #226 | Tragic 97.2% |
| Immigrants | Pakistan | 3.7 /100 | #227 | Tragic 97.2% |
| Sub-Saharan Africans | 3.6 /100 | #228 | Tragic 97.2% |
| Liberians | 3.6 /100 | #229 | Tragic 97.2% |
| Uruguayans | 3.5 /100 | #230 | Tragic 97.2% |
Demographics Similar to Crow by 4th Grade
In terms of 4th grade, the demographic groups most similar to Crow are Welsh (98.7%, a difference of 0.88%), Tsimshian (98.6%, a difference of 0.94%), Inupiat (98.6%, a difference of 1.0%), Yup'ik (98.5%, a difference of 1.0%), and Norwegian (98.5%, a difference of 1.1%).
| Demographics | Rating | Rank | 4th Grade |
| Crow | 100.0 /100 | #1 | Exceptional 99.6% |
| Welsh | 100.0 /100 | #2 | Exceptional 98.7% |
| Tsimshian | 100.0 /100 | #3 | Exceptional 98.6% |
| Inupiat | 100.0 /100 | #4 | Exceptional 98.6% |
| Yup'ik | 100.0 /100 | #5 | Exceptional 98.5% |
| Norwegians | 100.0 /100 | #6 | Exceptional 98.5% |
| Slovaks | 100.0 /100 | #7 | Exceptional 98.5% |
| Germans | 100.0 /100 | #8 | Exceptional 98.5% |
| Slovenes | 100.0 /100 | #9 | Exceptional 98.4% |
| Alaskan Athabascans | 100.0 /100 | #10 | Exceptional 98.4% |
| English | 100.0 /100 | #11 | Exceptional 98.4% |
| Tlingit-Haida | 100.0 /100 | #12 | Exceptional 98.4% |
| Swedes | 100.0 /100 | #13 | Exceptional 98.4% |
| Carpatho Rusyns | 100.0 /100 | #14 | Exceptional 98.4% |
| Dutch | 100.0 /100 | #15 | Exceptional 98.4% |