Immigrants from St. Vincent and the Grenadines vs Cuban 3rd Grade
COMPARE
Immigrants from St. Vincent and the Grenadines
Cuban
3rd Grade
3rd Grade Comparison
Immigrants from St. Vincent and the Grenadines
Cubans
97.1%
3RD GRADE
0.0/ 100
METRIC RATING
287th/ 347
METRIC RANK
97.3%
3RD GRADE
0.2/ 100
METRIC RATING
268th/ 347
METRIC RANK
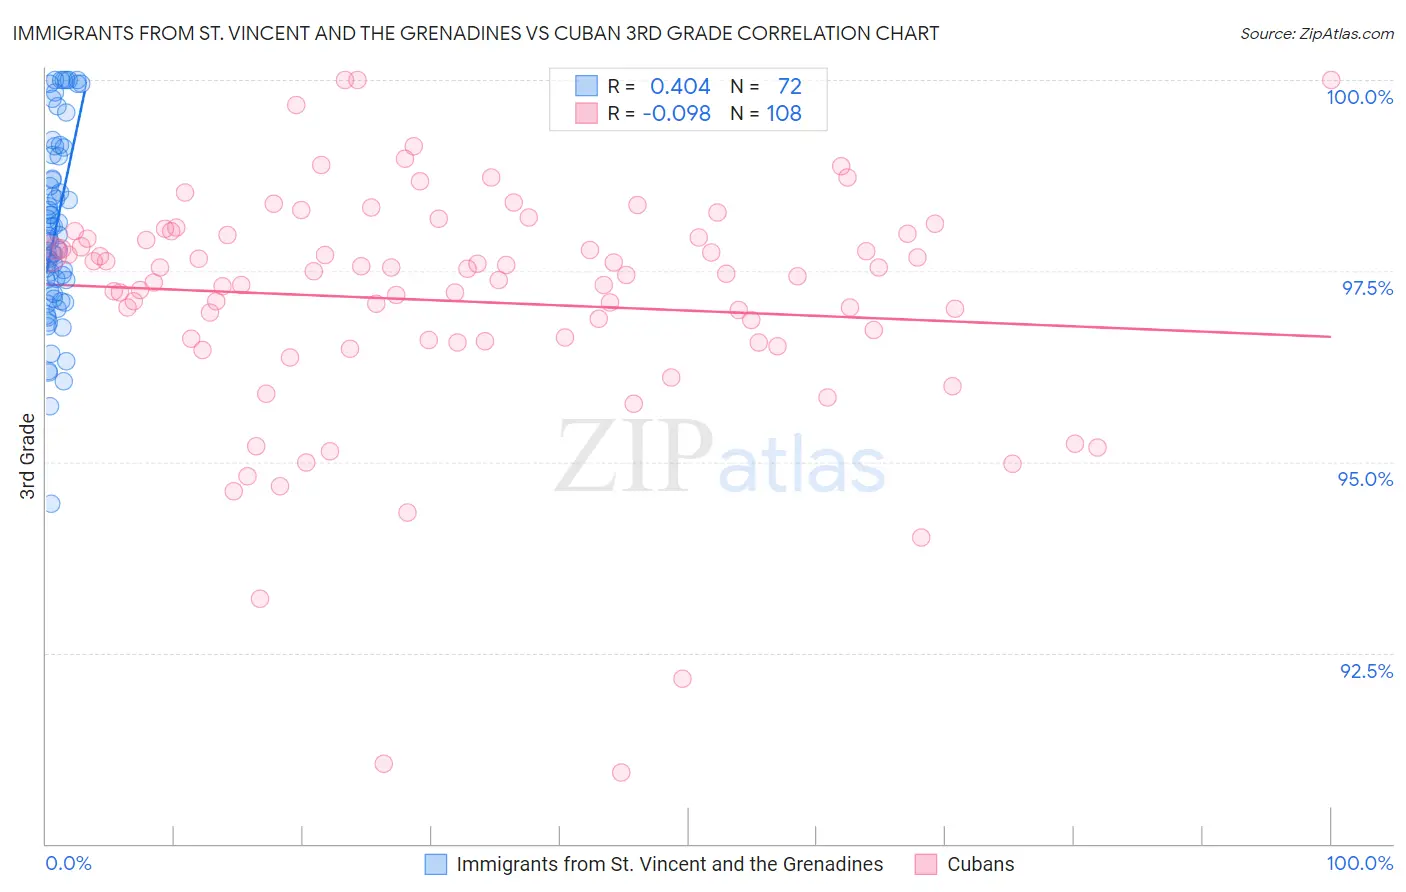
Immigrants from St. Vincent and the Grenadines vs Cuban 3rd Grade Correlation Chart
The statistical analysis conducted on geographies consisting of 56,176,062 people shows a moderate positive correlation between the proportion of Immigrants from St. Vincent and the Grenadines and percentage of population with at least 3rd grade education in the United States with a correlation coefficient (R) of 0.404 and weighted average of 97.1%. Similarly, the statistical analysis conducted on geographies consisting of 449,326,865 people shows a slight negative correlation between the proportion of Cubans and percentage of population with at least 3rd grade education in the United States with a correlation coefficient (R) of -0.098 and weighted average of 97.3%, a difference of 0.18%.
3rd Grade Correlation Summary
| Measurement | Immigrants from St. Vincent and the Grenadines | Cuban |
| Minimum | 94.4% | 90.9% |
| Maximum | 100.0% | 100.0% |
| Range | 5.6% | 9.1% |
| Mean | 98.0% | 97.1% |
| Median | 97.9% | 97.5% |
| Interquartile 25% (IQ1) | 97.2% | 96.6% |
| Interquartile 75% (IQ3) | 99.0% | 98.0% |
| Interquartile Range (IQR) | 1.8% | 1.4% |
| Standard Deviation (Sample) | 1.2% | 1.6% |
| Standard Deviation (Population) | 1.2% | 1.6% |
Demographics Similar to Immigrants from St. Vincent and the Grenadines and Cubans by 3rd Grade
In terms of 3rd grade, the demographic groups most similar to Immigrants from St. Vincent and the Grenadines are Immigrants from Barbados (97.1%, a difference of 0.010%), Immigrants from Hong Kong (97.1%, a difference of 0.020%), Immigrants from Trinidad and Tobago (97.1%, a difference of 0.040%), Houma (97.1%, a difference of 0.050%), and Afghan (97.1%, a difference of 0.060%). Similarly, the demographic groups most similar to Cubans are Fijian (97.3%, a difference of 0.0%), Immigrants from Nigeria (97.3%, a difference of 0.010%), Immigrants from China (97.2%, a difference of 0.030%), Puerto Rican (97.2%, a difference of 0.040%), and Ghanaian (97.2%, a difference of 0.040%).
| Demographics | Rating | Rank | 3rd Grade |
| Immigrants | Nigeria | 0.3 /100 | #267 | Tragic 97.3% |
| Cubans | 0.2 /100 | #268 | Tragic 97.3% |
| Fijians | 0.2 /100 | #269 | Tragic 97.3% |
| Immigrants | China | 0.2 /100 | #270 | Tragic 97.2% |
| Puerto Ricans | 0.2 /100 | #271 | Tragic 97.2% |
| Ghanaians | 0.1 /100 | #272 | Tragic 97.2% |
| Immigrants | Peru | 0.1 /100 | #273 | Tragic 97.2% |
| Immigrants | Cameroon | 0.1 /100 | #274 | Tragic 97.2% |
| Immigrants | Uzbekistan | 0.1 /100 | #275 | Tragic 97.2% |
| Immigrants | Bolivia | 0.1 /100 | #276 | Tragic 97.2% |
| Trinidadians and Tobagonians | 0.1 /100 | #277 | Tragic 97.2% |
| Immigrants | Western Africa | 0.1 /100 | #278 | Tragic 97.2% |
| Immigrants | Philippines | 0.1 /100 | #279 | Tragic 97.2% |
| Immigrants | Ghana | 0.1 /100 | #280 | Tragic 97.2% |
| Barbadians | 0.1 /100 | #281 | Tragic 97.2% |
| Afghans | 0.1 /100 | #282 | Tragic 97.1% |
| Houma | 0.1 /100 | #283 | Tragic 97.1% |
| Immigrants | Trinidad and Tobago | 0.0 /100 | #284 | Tragic 97.1% |
| Immigrants | Hong Kong | 0.0 /100 | #285 | Tragic 97.1% |
| Immigrants | Barbados | 0.0 /100 | #286 | Tragic 97.1% |
| Immigrants | St. Vincent and the Grenadines | 0.0 /100 | #287 | Tragic 97.1% |