Immigrants from St. Vincent and the Grenadines vs Bermudan Kindergarten
COMPARE
Immigrants from St. Vincent and the Grenadines
Bermudan
Kindergarten
Kindergarten Comparison
Immigrants from St. Vincent and the Grenadines
Bermudans
97.3%
KINDERGARTEN
0.0/ 100
METRIC RATING
290th/ 347
METRIC RANK
98.0%
KINDERGARTEN
54.0/ 100
METRIC RATING
170th/ 347
METRIC RANK
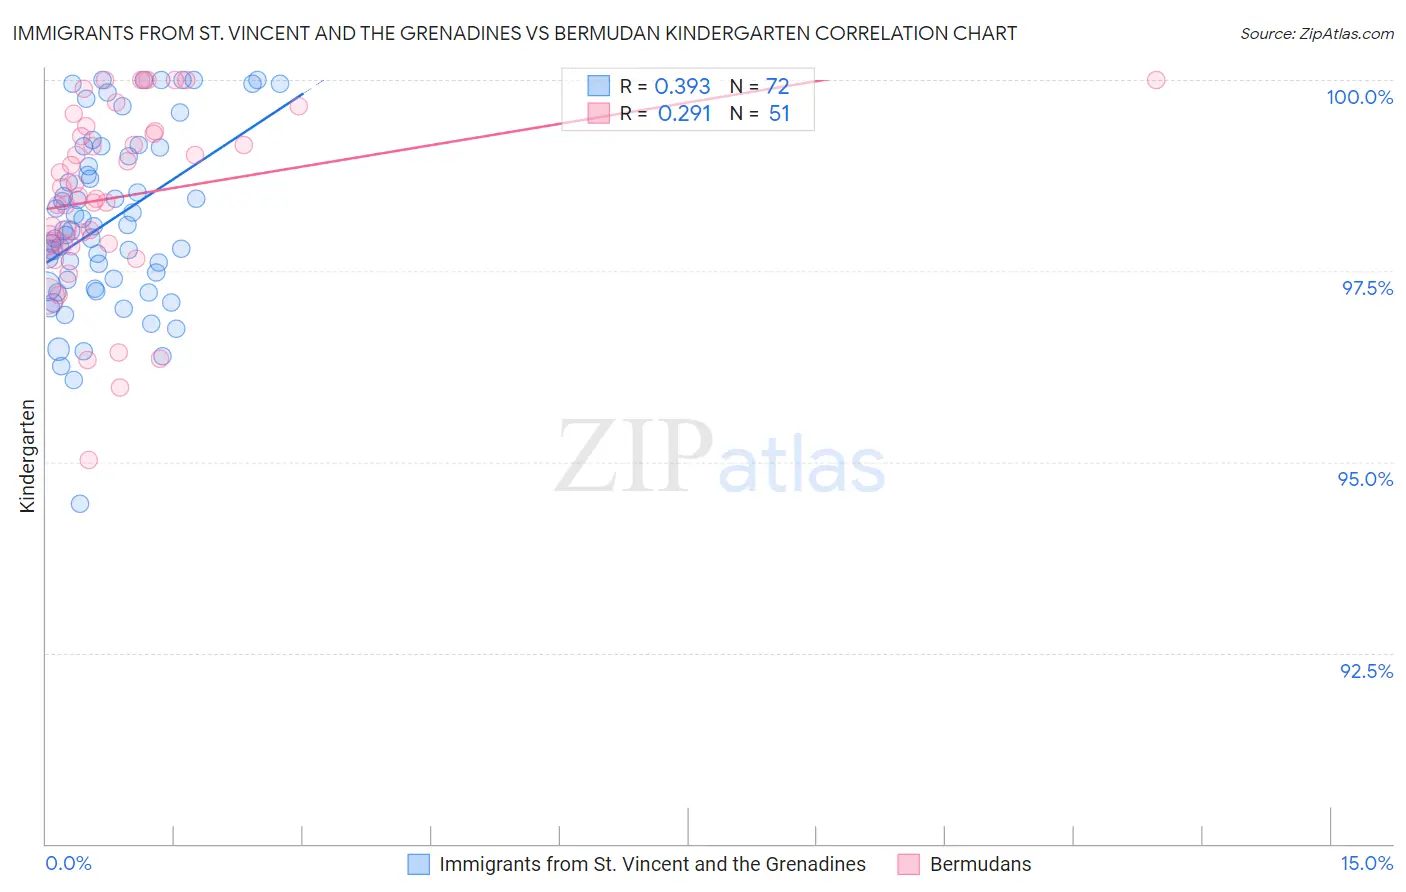
Immigrants from St. Vincent and the Grenadines vs Bermudan Kindergarten Correlation Chart
The statistical analysis conducted on geographies consisting of 56,176,062 people shows a mild positive correlation between the proportion of Immigrants from St. Vincent and the Grenadines and percentage of population with at least kindergarten education in the United States with a correlation coefficient (R) of 0.393 and weighted average of 97.3%. Similarly, the statistical analysis conducted on geographies consisting of 55,721,975 people shows a weak positive correlation between the proportion of Bermudans and percentage of population with at least kindergarten education in the United States with a correlation coefficient (R) of 0.291 and weighted average of 98.0%, a difference of 0.70%.
Kindergarten Correlation Summary
| Measurement | Immigrants from St. Vincent and the Grenadines | Bermudan |
| Minimum | 94.4% | 95.0% |
| Maximum | 100.0% | 100.0% |
| Range | 5.6% | 5.0% |
| Mean | 98.1% | 98.5% |
| Median | 98.0% | 98.5% |
| Interquartile 25% (IQ1) | 97.3% | 97.9% |
| Interquartile 75% (IQ3) | 99.1% | 99.3% |
| Interquartile Range (IQR) | 1.7% | 1.5% |
| Standard Deviation (Sample) | 1.2% | 1.2% |
| Standard Deviation (Population) | 1.2% | 1.2% |
Similar Demographics by Kindergarten
Demographics Similar to Immigrants from St. Vincent and the Grenadines by Kindergarten
In terms of kindergarten, the demographic groups most similar to Immigrants from St. Vincent and the Grenadines are Immigrants from Afghanistan (97.3%, a difference of 0.010%), Houma (97.3%, a difference of 0.020%), Immigrants from Thailand (97.3%, a difference of 0.030%), British West Indian (97.3%, a difference of 0.030%), and Immigrants from Barbados (97.3%, a difference of 0.040%).
| Demographics | Rating | Rank | Kindergarten |
| Immigrants | West Indies | 0.0 /100 | #283 | Tragic 97.3% |
| Immigrants | Trinidad and Tobago | 0.0 /100 | #284 | Tragic 97.3% |
| Immigrants | Portugal | 0.0 /100 | #285 | Tragic 97.3% |
| Immigrants | Barbados | 0.0 /100 | #286 | Tragic 97.3% |
| Immigrants | Hong Kong | 0.0 /100 | #287 | Tragic 97.3% |
| Immigrants | Thailand | 0.0 /100 | #288 | Tragic 97.3% |
| Immigrants | Afghanistan | 0.0 /100 | #289 | Tragic 97.3% |
| Immigrants | St. Vincent and the Grenadines | 0.0 /100 | #290 | Tragic 97.3% |
| Houma | 0.0 /100 | #291 | Tragic 97.3% |
| British West Indians | 0.0 /100 | #292 | Tragic 97.3% |
| Malaysians | 0.0 /100 | #293 | Tragic 97.2% |
| Immigrants | Immigrants | 0.0 /100 | #294 | Tragic 97.2% |
| Immigrants | Grenada | 0.0 /100 | #295 | Tragic 97.2% |
| Immigrants | Eritrea | 0.0 /100 | #296 | Tragic 97.2% |
| Central American Indians | 0.0 /100 | #297 | Tragic 97.2% |
Demographics Similar to Bermudans by Kindergarten
In terms of kindergarten, the demographic groups most similar to Bermudans are Immigrants from Spain (98.0%, a difference of 0.0%), Navajo (98.0%, a difference of 0.0%), Immigrants from Korea (98.0%, a difference of 0.0%), Immigrants from Jordan (98.0%, a difference of 0.0%), and Spanish American (98.0%, a difference of 0.010%).
| Demographics | Rating | Rank | Kindergarten |
| Spanish Americans | 57.8 /100 | #163 | Average 98.0% |
| Immigrants | Micronesia | 57.7 /100 | #164 | Average 98.0% |
| Ugandans | 56.9 /100 | #165 | Average 98.0% |
| Chileans | 56.3 /100 | #166 | Average 98.0% |
| Immigrants | Spain | 54.6 /100 | #167 | Average 98.0% |
| Navajo | 54.4 /100 | #168 | Average 98.0% |
| Immigrants | Korea | 54.1 /100 | #169 | Average 98.0% |
| Bermudans | 54.0 /100 | #170 | Average 98.0% |
| Immigrants | Jordan | 54.0 /100 | #171 | Average 98.0% |
| Natives/Alaskans | 51.0 /100 | #172 | Average 98.0% |
| Kenyans | 51.0 /100 | #173 | Average 98.0% |
| Immigrants | Brazil | 50.0 /100 | #174 | Average 98.0% |
| Immigrants | Sri Lanka | 49.6 /100 | #175 | Average 97.9% |
| Albanians | 48.5 /100 | #176 | Average 97.9% |
| Immigrants | Venezuela | 47.9 /100 | #177 | Average 97.9% |