Immigrants from Sri Lanka vs Dutch West Indian 7th Grade
COMPARE
Immigrants from Sri Lanka
Dutch West Indian
7th Grade
7th Grade Comparison
Immigrants from Sri Lanka
Dutch West Indians
96.1%
7TH GRADE
59.9/ 100
METRIC RATING
167th/ 347
METRIC RANK
95.8%
7TH GRADE
16.1/ 100
METRIC RATING
209th/ 347
METRIC RANK
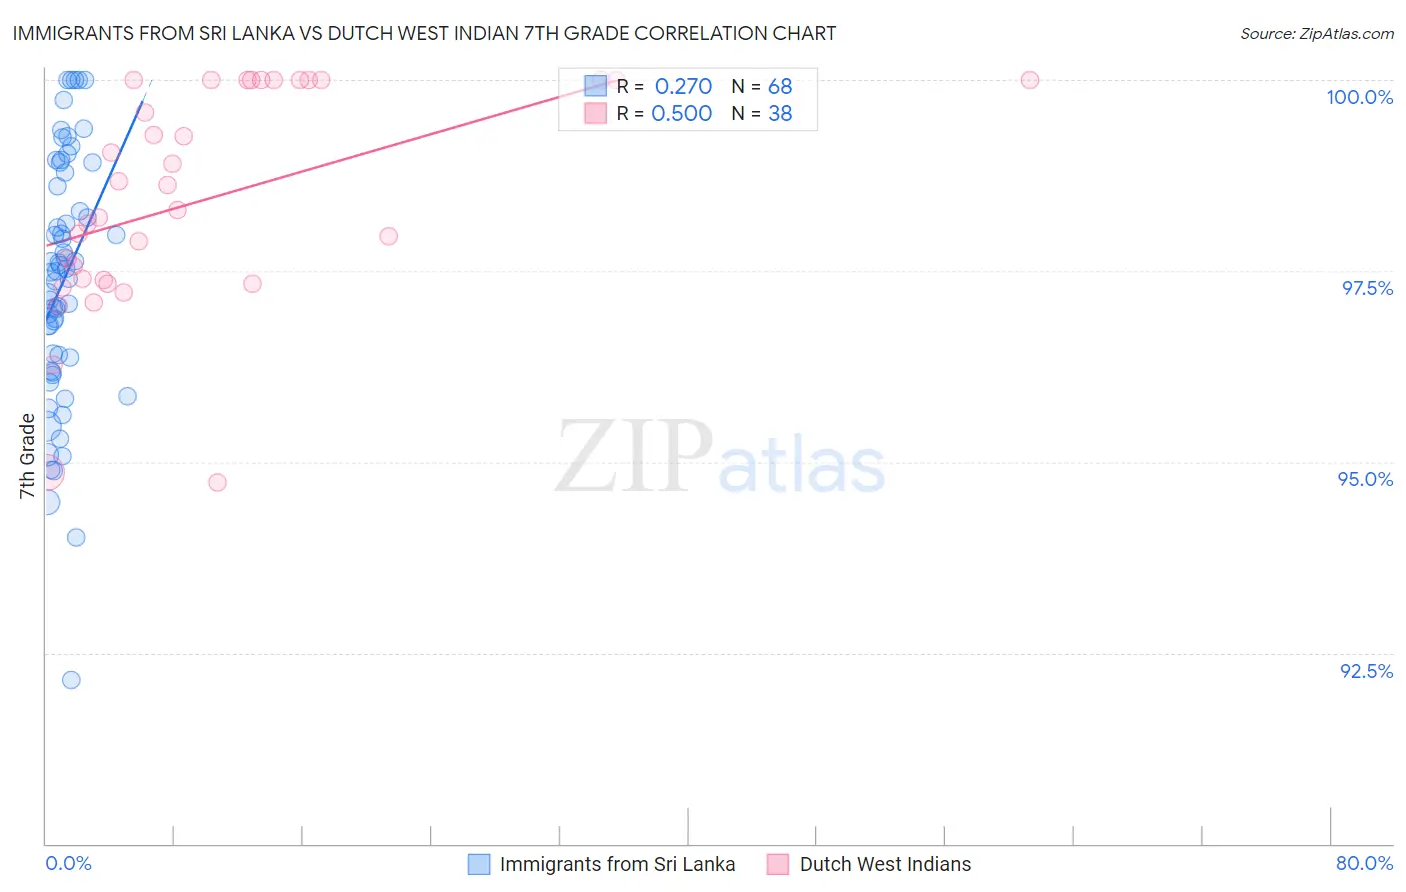
Immigrants from Sri Lanka vs Dutch West Indian 7th Grade Correlation Chart
The statistical analysis conducted on geographies consisting of 149,660,761 people shows a weak positive correlation between the proportion of Immigrants from Sri Lanka and percentage of population with at least 7th grade education in the United States with a correlation coefficient (R) of 0.270 and weighted average of 96.1%. Similarly, the statistical analysis conducted on geographies consisting of 85,775,604 people shows a substantial positive correlation between the proportion of Dutch West Indians and percentage of population with at least 7th grade education in the United States with a correlation coefficient (R) of 0.500 and weighted average of 95.8%, a difference of 0.32%.
7th Grade Correlation Summary
| Measurement | Immigrants from Sri Lanka | Dutch West Indian |
| Minimum | 92.1% | 94.7% |
| Maximum | 100.0% | 100.0% |
| Range | 7.9% | 5.3% |
| Mean | 97.4% | 98.4% |
| Median | 97.5% | 98.5% |
| Interquartile 25% (IQ1) | 96.3% | 97.4% |
| Interquartile 75% (IQ3) | 98.7% | 100.0% |
| Interquartile Range (IQR) | 2.4% | 2.6% |
| Standard Deviation (Sample) | 1.6% | 1.4% |
| Standard Deviation (Population) | 1.6% | 1.4% |
Similar Demographics by 7th Grade
Demographics Similar to Immigrants from Sri Lanka by 7th Grade
In terms of 7th grade, the demographic groups most similar to Immigrants from Sri Lanka are Immigrants from Italy (96.1%, a difference of 0.010%), Immigrants from Taiwan (96.1%, a difference of 0.010%), Immigrants from Kazakhstan (96.1%, a difference of 0.010%), Immigrants from Poland (96.1%, a difference of 0.010%), and Spaniard (96.1%, a difference of 0.020%).
| Demographics | Rating | Rank | 7th Grade |
| Immigrants | Kenya | 66.8 /100 | #160 | Good 96.1% |
| Bermudans | 66.3 /100 | #161 | Good 96.1% |
| Pima | 64.3 /100 | #162 | Good 96.1% |
| Spaniards | 62.6 /100 | #163 | Good 96.1% |
| Immigrants | Italy | 62.1 /100 | #164 | Good 96.1% |
| Immigrants | Taiwan | 61.5 /100 | #165 | Good 96.1% |
| Immigrants | Kazakhstan | 61.0 /100 | #166 | Good 96.1% |
| Immigrants | Sri Lanka | 59.9 /100 | #167 | Average 96.1% |
| Immigrants | Poland | 59.0 /100 | #168 | Average 96.1% |
| Ute | 55.8 /100 | #169 | Average 96.1% |
| Immigrants | Ukraine | 55.0 /100 | #170 | Average 96.1% |
| Egyptians | 54.2 /100 | #171 | Average 96.1% |
| Venezuelans | 51.4 /100 | #172 | Average 96.0% |
| Immigrants | Albania | 50.4 /100 | #173 | Average 96.0% |
| Mongolians | 50.0 /100 | #174 | Average 96.0% |
Demographics Similar to Dutch West Indians by 7th Grade
In terms of 7th grade, the demographic groups most similar to Dutch West Indians are Hawaiian (95.8%, a difference of 0.0%), Navajo (95.8%, a difference of 0.010%), Immigrants from Sudan (95.8%, a difference of 0.010%), African (95.8%, a difference of 0.020%), and Moroccan (95.8%, a difference of 0.030%).
| Demographics | Rating | Rank | 7th Grade |
| Immigrants | Northern Africa | 21.4 /100 | #202 | Fair 95.8% |
| Comanche | 21.1 /100 | #203 | Fair 95.8% |
| Assyrians/Chaldeans/Syriacs | 20.5 /100 | #204 | Fair 95.8% |
| Moroccans | 18.9 /100 | #205 | Poor 95.8% |
| Africans | 17.6 /100 | #206 | Poor 95.8% |
| Navajo | 17.0 /100 | #207 | Poor 95.8% |
| Immigrants | Sudan | 17.0 /100 | #208 | Poor 95.8% |
| Dutch West Indians | 16.1 /100 | #209 | Poor 95.8% |
| Hawaiians | 16.0 /100 | #210 | Poor 95.8% |
| Portuguese | 13.6 /100 | #211 | Poor 95.8% |
| Immigrants | Lebanon | 13.0 /100 | #212 | Poor 95.8% |
| Immigrants | Morocco | 12.6 /100 | #213 | Poor 95.8% |
| Bahamians | 11.6 /100 | #214 | Poor 95.7% |
| Spanish Americans | 9.3 /100 | #215 | Tragic 95.7% |
| Immigrants | Chile | 9.1 /100 | #216 | Tragic 95.7% |