Immigrants from Sri Lanka vs Cuban 7th Grade
COMPARE
Immigrants from Sri Lanka
Cuban
7th Grade
7th Grade Comparison
Immigrants from Sri Lanka
Cubans
96.1%
7TH GRADE
59.9/ 100
METRIC RATING
167th/ 347
METRIC RANK
94.6%
7TH GRADE
0.0/ 100
METRIC RATING
296th/ 347
METRIC RANK
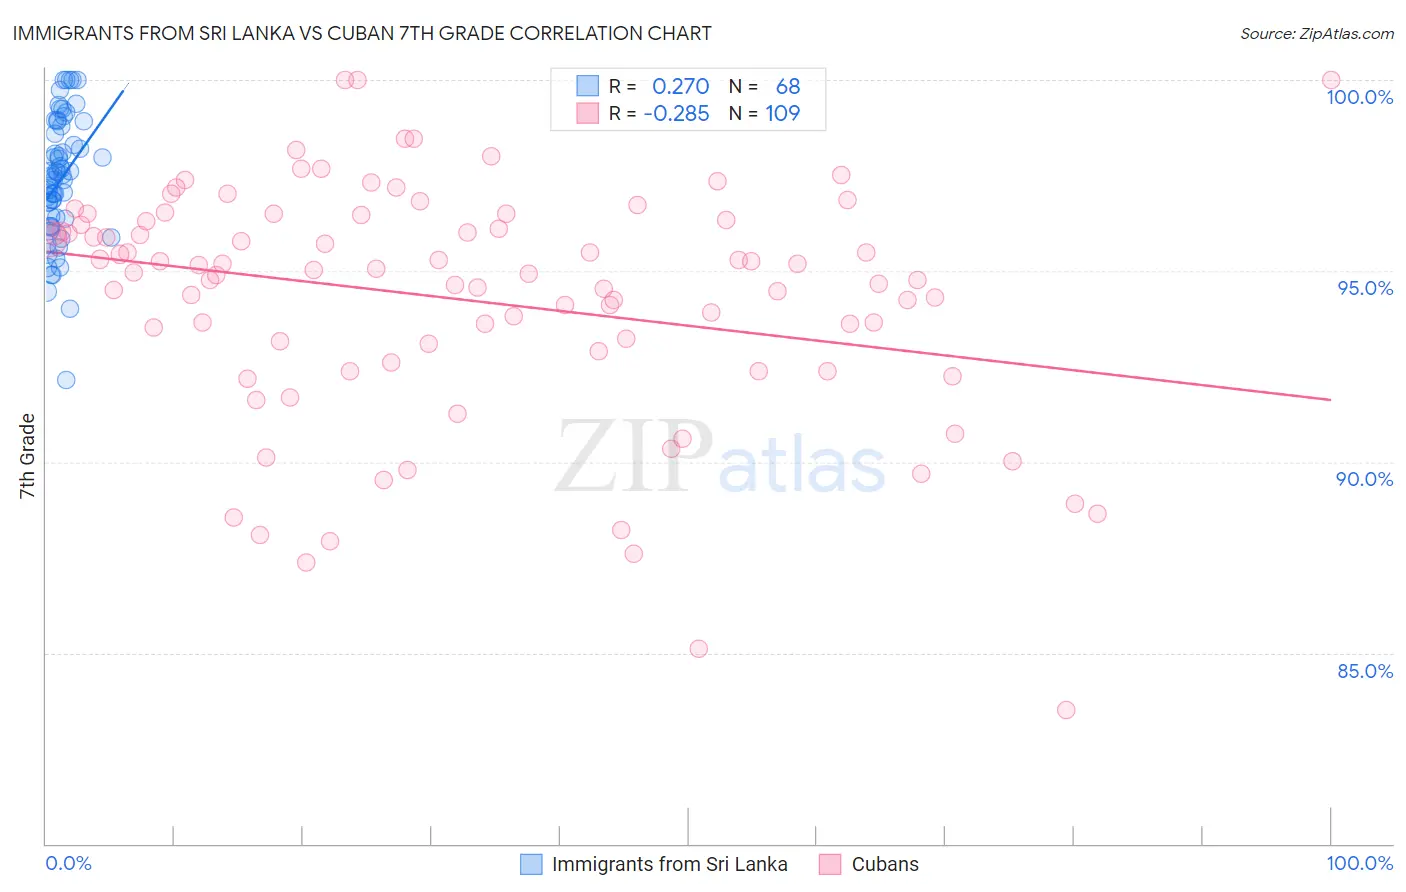
Immigrants from Sri Lanka vs Cuban 7th Grade Correlation Chart
The statistical analysis conducted on geographies consisting of 149,660,761 people shows a weak positive correlation between the proportion of Immigrants from Sri Lanka and percentage of population with at least 7th grade education in the United States with a correlation coefficient (R) of 0.270 and weighted average of 96.1%. Similarly, the statistical analysis conducted on geographies consisting of 449,368,946 people shows a weak negative correlation between the proportion of Cubans and percentage of population with at least 7th grade education in the United States with a correlation coefficient (R) of -0.285 and weighted average of 94.6%, a difference of 1.6%.
7th Grade Correlation Summary
| Measurement | Immigrants from Sri Lanka | Cuban |
| Minimum | 92.1% | 83.5% |
| Maximum | 100.0% | 100.0% |
| Range | 7.9% | 16.5% |
| Mean | 97.4% | 94.2% |
| Median | 97.5% | 94.9% |
| Interquartile 25% (IQ1) | 96.3% | 92.7% |
| Interquartile 75% (IQ3) | 98.7% | 96.3% |
| Interquartile Range (IQR) | 2.4% | 3.6% |
| Standard Deviation (Sample) | 1.6% | 3.1% |
| Standard Deviation (Population) | 1.6% | 3.1% |
Similar Demographics by 7th Grade
Demographics Similar to Immigrants from Sri Lanka by 7th Grade
In terms of 7th grade, the demographic groups most similar to Immigrants from Sri Lanka are Immigrants from Italy (96.1%, a difference of 0.010%), Immigrants from Taiwan (96.1%, a difference of 0.010%), Immigrants from Kazakhstan (96.1%, a difference of 0.010%), Immigrants from Poland (96.1%, a difference of 0.010%), and Spaniard (96.1%, a difference of 0.020%).
| Demographics | Rating | Rank | 7th Grade |
| Immigrants | Kenya | 66.8 /100 | #160 | Good 96.1% |
| Bermudans | 66.3 /100 | #161 | Good 96.1% |
| Pima | 64.3 /100 | #162 | Good 96.1% |
| Spaniards | 62.6 /100 | #163 | Good 96.1% |
| Immigrants | Italy | 62.1 /100 | #164 | Good 96.1% |
| Immigrants | Taiwan | 61.5 /100 | #165 | Good 96.1% |
| Immigrants | Kazakhstan | 61.0 /100 | #166 | Good 96.1% |
| Immigrants | Sri Lanka | 59.9 /100 | #167 | Average 96.1% |
| Immigrants | Poland | 59.0 /100 | #168 | Average 96.1% |
| Ute | 55.8 /100 | #169 | Average 96.1% |
| Immigrants | Ukraine | 55.0 /100 | #170 | Average 96.1% |
| Egyptians | 54.2 /100 | #171 | Average 96.1% |
| Venezuelans | 51.4 /100 | #172 | Average 96.0% |
| Immigrants | Albania | 50.4 /100 | #173 | Average 96.0% |
| Mongolians | 50.0 /100 | #174 | Average 96.0% |
Demographics Similar to Cubans by 7th Grade
In terms of 7th grade, the demographic groups most similar to Cubans are Yaqui (94.6%, a difference of 0.010%), Haitian (94.7%, a difference of 0.040%), Immigrants from South Eastern Asia (94.5%, a difference of 0.10%), Indonesian (94.5%, a difference of 0.11%), and Bangladeshi (94.5%, a difference of 0.11%).
| Demographics | Rating | Rank | 7th Grade |
| Taiwanese | 0.0 /100 | #289 | Tragic 94.8% |
| Malaysians | 0.0 /100 | #290 | Tragic 94.8% |
| Immigrants | Grenada | 0.0 /100 | #291 | Tragic 94.8% |
| Immigrants | West Indies | 0.0 /100 | #292 | Tragic 94.8% |
| Fijians | 0.0 /100 | #293 | Tragic 94.7% |
| Haitians | 0.0 /100 | #294 | Tragic 94.7% |
| Yaqui | 0.0 /100 | #295 | Tragic 94.6% |
| Cubans | 0.0 /100 | #296 | Tragic 94.6% |
| Immigrants | South Eastern Asia | 0.0 /100 | #297 | Tragic 94.5% |
| Indonesians | 0.0 /100 | #298 | Tragic 94.5% |
| Bangladeshis | 0.0 /100 | #299 | Tragic 94.5% |
| Immigrants | Burma/Myanmar | 0.0 /100 | #300 | Tragic 94.5% |
| Immigrants | Dominica | 0.0 /100 | #301 | Tragic 94.5% |
| Immigrants | Laos | 0.0 /100 | #302 | Tragic 94.5% |
| Sri Lankans | 0.0 /100 | #303 | Tragic 94.4% |