Immigrants from Germany vs Immigrants from Sierra Leone 7th Grade
COMPARE
Immigrants from Germany
Immigrants from Sierra Leone
7th Grade
7th Grade Comparison
Immigrants from Germany
Immigrants from Sierra Leone
96.7%
7TH GRADE
98.7/ 100
METRIC RATING
97th/ 347
METRIC RANK
95.5%
7TH GRADE
2.0/ 100
METRIC RATING
240th/ 347
METRIC RANK
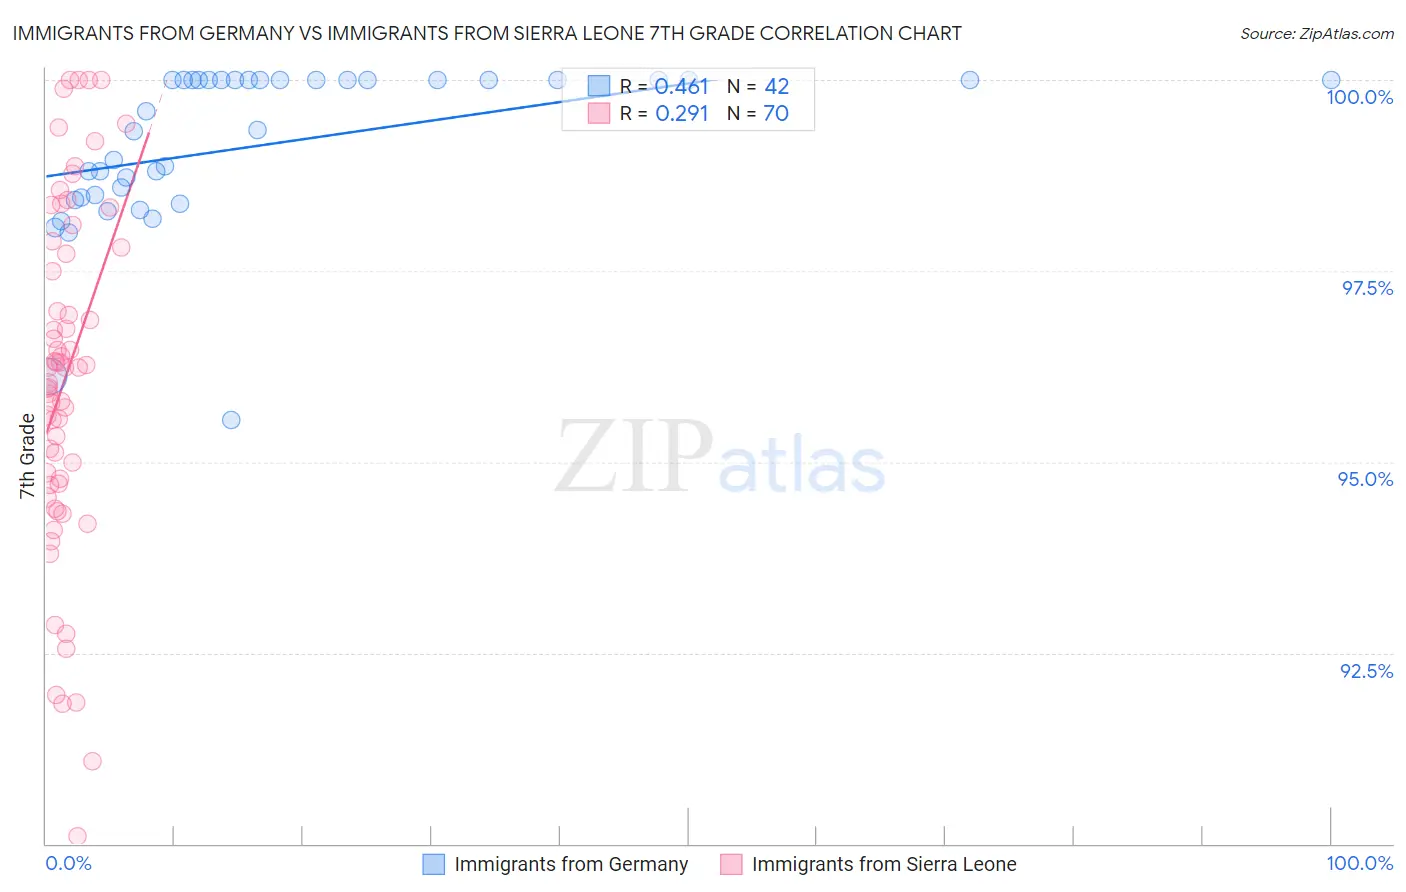
Immigrants from Germany vs Immigrants from Sierra Leone 7th Grade Correlation Chart
The statistical analysis conducted on geographies consisting of 463,886,845 people shows a moderate positive correlation between the proportion of Immigrants from Germany and percentage of population with at least 7th grade education in the United States with a correlation coefficient (R) of 0.461 and weighted average of 96.7%. Similarly, the statistical analysis conducted on geographies consisting of 101,634,956 people shows a weak positive correlation between the proportion of Immigrants from Sierra Leone and percentage of population with at least 7th grade education in the United States with a correlation coefficient (R) of 0.291 and weighted average of 95.5%, a difference of 1.3%.
7th Grade Correlation Summary
| Measurement | Immigrants from Germany | Immigrants from Sierra Leone |
| Minimum | 95.6% | 90.1% |
| Maximum | 100.0% | 100.0% |
| Range | 4.4% | 9.9% |
| Mean | 99.1% | 96.1% |
| Median | 99.5% | 96.2% |
| Interquartile 25% (IQ1) | 98.5% | 94.7% |
| Interquartile 75% (IQ3) | 100.0% | 97.8% |
| Interquartile Range (IQR) | 1.5% | 3.1% |
| Standard Deviation (Sample) | 1.1% | 2.3% |
| Standard Deviation (Population) | 1.0% | 2.3% |
Similar Demographics by 7th Grade
Demographics Similar to Immigrants from Germany by 7th Grade
In terms of 7th grade, the demographic groups most similar to Immigrants from Germany are Immigrants from Denmark (96.7%, a difference of 0.0%), Immigrants from Sweden (96.7%, a difference of 0.0%), Menominee (96.7%, a difference of 0.0%), Immigrants from Australia (96.7%, a difference of 0.010%), and German Russian (96.7%, a difference of 0.010%).
| Demographics | Rating | Rank | 7th Grade |
| Immigrants | South Africa | 98.9 /100 | #90 | Exceptional 96.7% |
| Osage | 98.9 /100 | #91 | Exceptional 96.7% |
| Immigrants | Western Europe | 98.9 /100 | #92 | Exceptional 96.7% |
| Potawatomi | 98.9 /100 | #93 | Exceptional 96.7% |
| Lebanese | 98.8 /100 | #94 | Exceptional 96.7% |
| Immigrants | Australia | 98.8 /100 | #95 | Exceptional 96.7% |
| Immigrants | Denmark | 98.7 /100 | #96 | Exceptional 96.7% |
| Immigrants | Germany | 98.7 /100 | #97 | Exceptional 96.7% |
| Immigrants | Sweden | 98.7 /100 | #98 | Exceptional 96.7% |
| Menominee | 98.7 /100 | #99 | Exceptional 96.7% |
| German Russians | 98.6 /100 | #100 | Exceptional 96.7% |
| Thais | 98.6 /100 | #101 | Exceptional 96.7% |
| Immigrants | Czechoslovakia | 98.3 /100 | #102 | Exceptional 96.6% |
| Immigrants | Singapore | 98.3 /100 | #103 | Exceptional 96.6% |
| Shoshone | 98.1 /100 | #104 | Exceptional 96.6% |
Demographics Similar to Immigrants from Sierra Leone by 7th Grade
In terms of 7th grade, the demographic groups most similar to Immigrants from Sierra Leone are South American Indian (95.5%, a difference of 0.0%), Immigrants from Senegal (95.5%, a difference of 0.0%), Indian (Asian) (95.5%, a difference of 0.020%), Jamaican (95.5%, a difference of 0.020%), and Immigrants from Asia (95.5%, a difference of 0.030%).
| Demographics | Rating | Rank | 7th Grade |
| Immigrants | Indonesia | 3.3 /100 | #233 | Tragic 95.5% |
| Nigerians | 3.0 /100 | #234 | Tragic 95.5% |
| Immigrants | Africa | 2.7 /100 | #235 | Tragic 95.5% |
| Asians | 2.6 /100 | #236 | Tragic 95.5% |
| Immigrants | Asia | 2.3 /100 | #237 | Tragic 95.5% |
| Indians (Asian) | 2.3 /100 | #238 | Tragic 95.5% |
| Jamaicans | 2.2 /100 | #239 | Tragic 95.5% |
| Immigrants | Sierra Leone | 2.0 /100 | #240 | Tragic 95.5% |
| South American Indians | 2.0 /100 | #241 | Tragic 95.5% |
| Immigrants | Senegal | 1.9 /100 | #242 | Tragic 95.5% |
| U.S. Virgin Islanders | 1.6 /100 | #243 | Tragic 95.4% |
| Uruguayans | 1.6 /100 | #244 | Tragic 95.4% |
| Immigrants | Middle Africa | 1.5 /100 | #245 | Tragic 95.4% |
| Ethiopians | 1.5 /100 | #246 | Tragic 95.4% |
| Tongans | 1.3 /100 | #247 | Tragic 95.4% |