Immigrants from Sri Lanka vs Estonian 4th Grade
COMPARE
Immigrants from Sri Lanka
Estonian
4th Grade
4th Grade Comparison
Immigrants from Sri Lanka
Estonians
97.5%
4TH GRADE
51.1/ 100
METRIC RATING
172nd/ 347
METRIC RANK
98.1%
4TH GRADE
99.8/ 100
METRIC RATING
48th/ 347
METRIC RANK
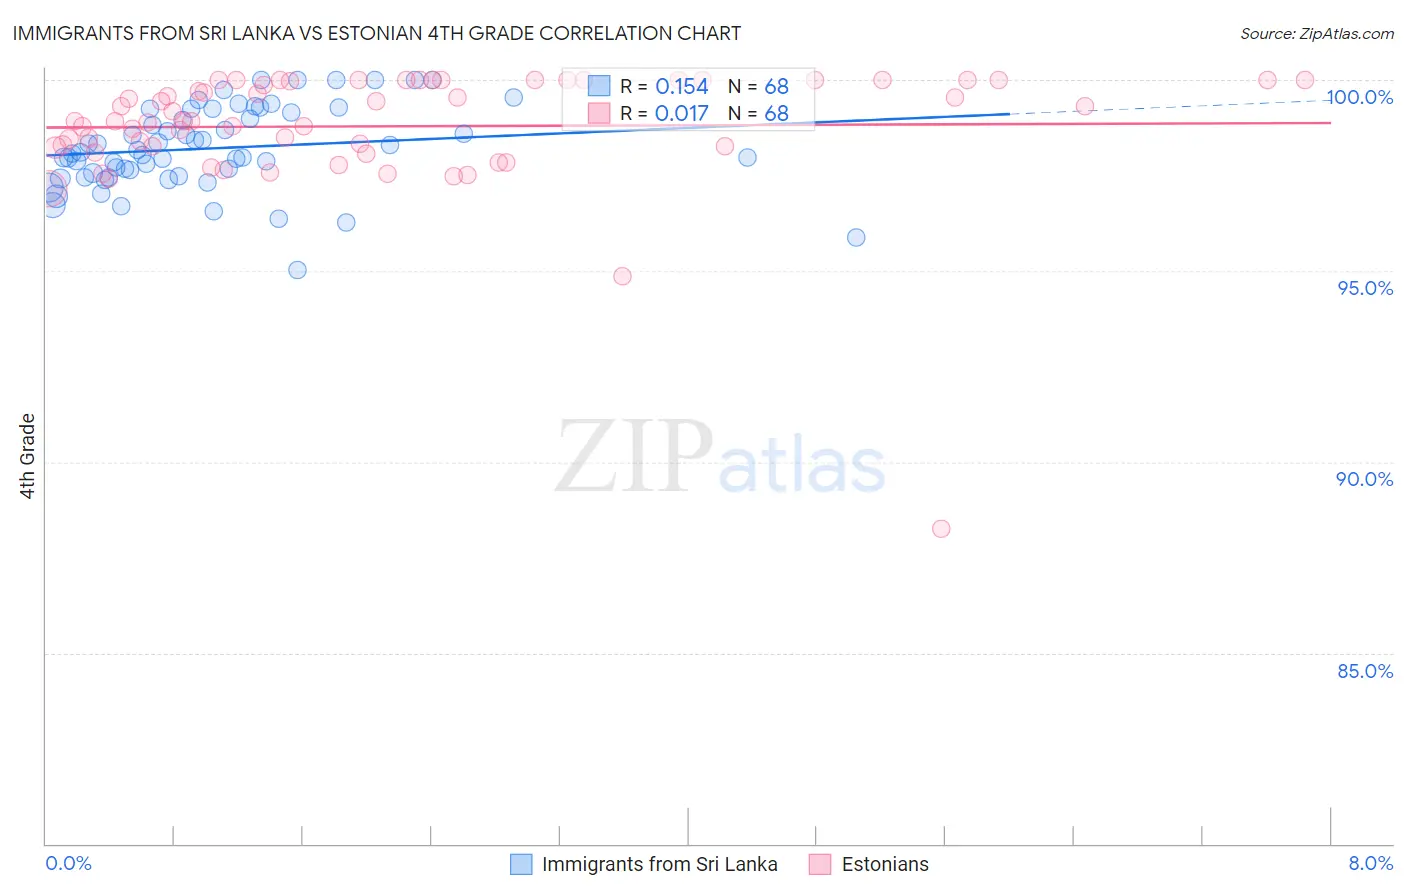
Immigrants from Sri Lanka vs Estonian 4th Grade Correlation Chart
The statistical analysis conducted on geographies consisting of 149,660,761 people shows a poor positive correlation between the proportion of Immigrants from Sri Lanka and percentage of population with at least 4th grade education in the United States with a correlation coefficient (R) of 0.154 and weighted average of 97.5%. Similarly, the statistical analysis conducted on geographies consisting of 123,528,404 people shows no correlation between the proportion of Estonians and percentage of population with at least 4th grade education in the United States with a correlation coefficient (R) of 0.017 and weighted average of 98.1%, a difference of 0.60%.
4th Grade Correlation Summary
| Measurement | Immigrants from Sri Lanka | Estonian |
| Minimum | 95.0% | 88.3% |
| Maximum | 100.0% | 100.0% |
| Range | 5.0% | 11.7% |
| Mean | 98.2% | 98.8% |
| Median | 98.1% | 98.9% |
| Interquartile 25% (IQ1) | 97.5% | 98.2% |
| Interquartile 75% (IQ3) | 99.2% | 100.0% |
| Interquartile Range (IQR) | 1.7% | 1.8% |
| Standard Deviation (Sample) | 1.1% | 1.7% |
| Standard Deviation (Population) | 1.1% | 1.6% |
Similar Demographics by 4th Grade
Demographics Similar to Immigrants from Sri Lanka by 4th Grade
In terms of 4th grade, the demographic groups most similar to Immigrants from Sri Lanka are Immigrants from Spain (97.5%, a difference of 0.0%), Brazilian (97.5%, a difference of 0.0%), Immigrants from Korea (97.5%, a difference of 0.0%), Egyptian (97.5%, a difference of 0.0%), and Chilean (97.5%, a difference of 0.010%).
| Demographics | Rating | Rank | 4th Grade |
| Venezuelans | 58.7 /100 | #165 | Average 97.6% |
| Kenyans | 56.5 /100 | #166 | Average 97.5% |
| Immigrants | Poland | 55.9 /100 | #167 | Average 97.5% |
| Immigrants | Belarus | 55.8 /100 | #168 | Average 97.5% |
| Chileans | 54.4 /100 | #169 | Average 97.5% |
| Immigrants | Spain | 51.8 /100 | #170 | Average 97.5% |
| Brazilians | 51.5 /100 | #171 | Average 97.5% |
| Immigrants | Sri Lanka | 51.1 /100 | #172 | Average 97.5% |
| Immigrants | Korea | 50.6 /100 | #173 | Average 97.5% |
| Egyptians | 50.0 /100 | #174 | Average 97.5% |
| Immigrants | Micronesia | 49.6 /100 | #175 | Average 97.5% |
| Arabs | 48.7 /100 | #176 | Average 97.5% |
| Immigrants | Brazil | 46.1 /100 | #177 | Average 97.5% |
| Comanche | 45.3 /100 | #178 | Average 97.5% |
| Immigrants | Kazakhstan | 43.6 /100 | #179 | Average 97.5% |
Demographics Similar to Estonians by 4th Grade
In terms of 4th grade, the demographic groups most similar to Estonians are Bulgarian (98.1%, a difference of 0.0%), Immigrants from Scotland (98.1%, a difference of 0.010%), Celtic (98.1%, a difference of 0.010%), Czechoslovakian (98.1%, a difference of 0.020%), and Ottawa (98.1%, a difference of 0.020%).
| Demographics | Rating | Rank | 4th Grade |
| Eastern Europeans | 99.9 /100 | #41 | Exceptional 98.2% |
| Hungarians | 99.9 /100 | #42 | Exceptional 98.2% |
| Northern Europeans | 99.9 /100 | #43 | Exceptional 98.2% |
| Native Hawaiians | 99.9 /100 | #44 | Exceptional 98.1% |
| Czechoslovakians | 99.9 /100 | #45 | Exceptional 98.1% |
| Ottawa | 99.9 /100 | #46 | Exceptional 98.1% |
| Arapaho | 99.9 /100 | #47 | Exceptional 98.1% |
| Estonians | 99.8 /100 | #48 | Exceptional 98.1% |
| Bulgarians | 99.8 /100 | #49 | Exceptional 98.1% |
| Immigrants | Scotland | 99.8 /100 | #50 | Exceptional 98.1% |
| Celtics | 99.8 /100 | #51 | Exceptional 98.1% |
| Australians | 99.8 /100 | #52 | Exceptional 98.1% |
| Slavs | 99.8 /100 | #53 | Exceptional 98.1% |
| Maltese | 99.8 /100 | #54 | Exceptional 98.1% |
| Whites/Caucasians | 99.8 /100 | #55 | Exceptional 98.1% |