Immigrants from Sri Lanka vs Kenyan 4th Grade
COMPARE
Immigrants from Sri Lanka
Kenyan
4th Grade
4th Grade Comparison
Immigrants from Sri Lanka
Kenyans
97.5%
4TH GRADE
51.1/ 100
METRIC RATING
172nd/ 347
METRIC RANK
97.5%
4TH GRADE
56.5/ 100
METRIC RATING
166th/ 347
METRIC RANK
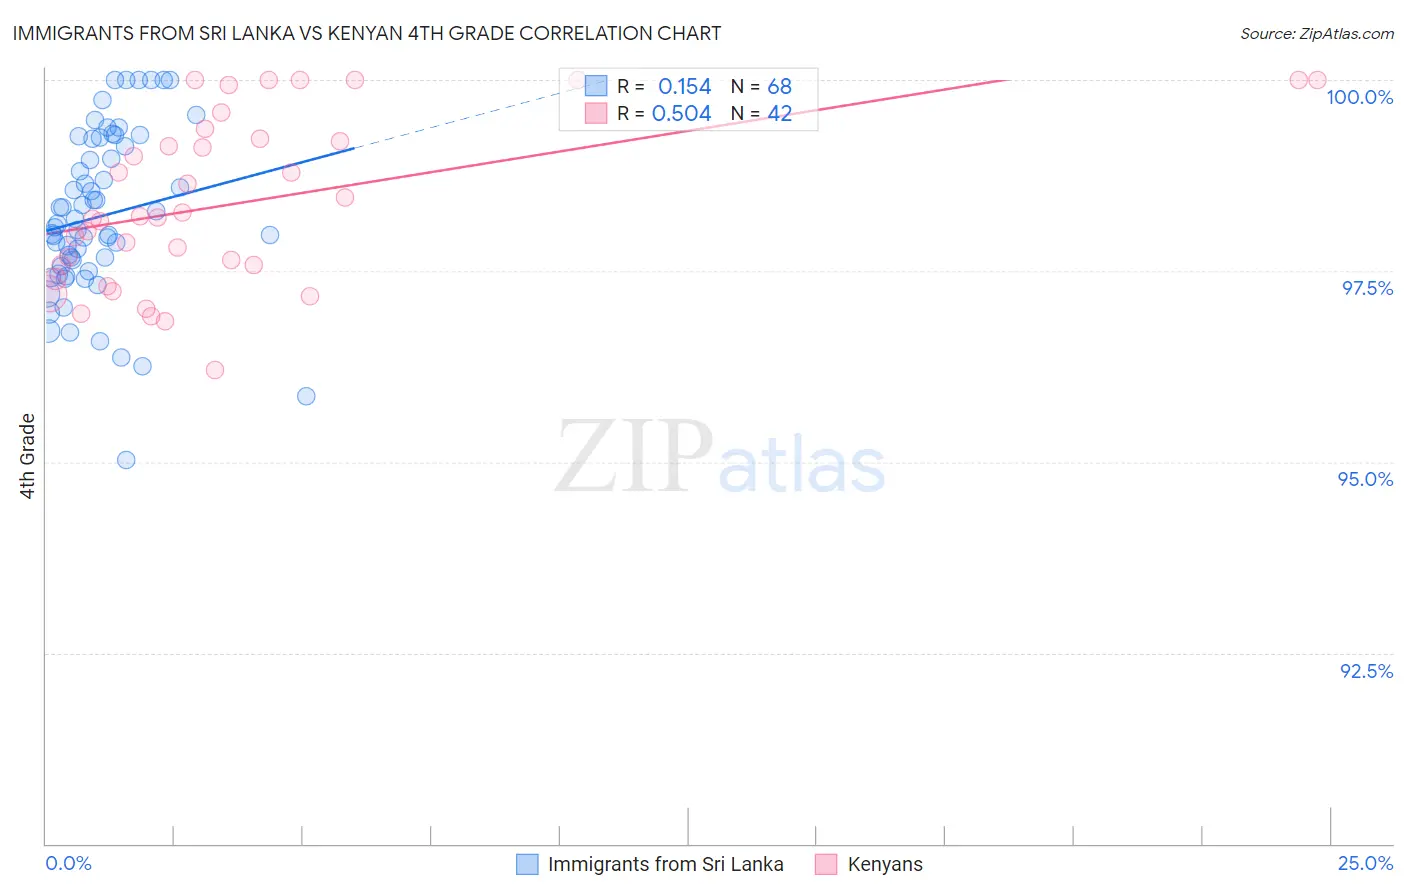
Immigrants from Sri Lanka vs Kenyan 4th Grade Correlation Chart
The statistical analysis conducted on geographies consisting of 149,660,761 people shows a poor positive correlation between the proportion of Immigrants from Sri Lanka and percentage of population with at least 4th grade education in the United States with a correlation coefficient (R) of 0.154 and weighted average of 97.5%. Similarly, the statistical analysis conducted on geographies consisting of 168,244,481 people shows a substantial positive correlation between the proportion of Kenyans and percentage of population with at least 4th grade education in the United States with a correlation coefficient (R) of 0.504 and weighted average of 97.5%, a difference of 0.020%.
4th Grade Correlation Summary
| Measurement | Immigrants from Sri Lanka | Kenyan |
| Minimum | 95.0% | 96.2% |
| Maximum | 100.0% | 100.0% |
| Range | 5.0% | 3.8% |
| Mean | 98.2% | 98.4% |
| Median | 98.1% | 98.2% |
| Interquartile 25% (IQ1) | 97.5% | 97.6% |
| Interquartile 75% (IQ3) | 99.2% | 99.2% |
| Interquartile Range (IQR) | 1.7% | 1.6% |
| Standard Deviation (Sample) | 1.1% | 1.1% |
| Standard Deviation (Population) | 1.1% | 1.1% |
Demographics Similar to Immigrants from Sri Lanka and Kenyans by 4th Grade
In terms of 4th grade, the demographic groups most similar to Immigrants from Sri Lanka are Immigrants from Spain (97.5%, a difference of 0.0%), Brazilian (97.5%, a difference of 0.0%), Immigrants from Korea (97.5%, a difference of 0.0%), Egyptian (97.5%, a difference of 0.0%), and Chilean (97.5%, a difference of 0.010%). Similarly, the demographic groups most similar to Kenyans are Immigrants from Poland (97.5%, a difference of 0.0%), Immigrants from Belarus (97.5%, a difference of 0.0%), Immigrants from Iran (97.6%, a difference of 0.010%), Ugandan (97.6%, a difference of 0.010%), and Venezuelan (97.6%, a difference of 0.010%).
| Demographics | Rating | Rank | 4th Grade |
| Immigrants | Italy | 63.7 /100 | #159 | Good 97.6% |
| Apache | 61.3 /100 | #160 | Good 97.6% |
| Marshallese | 60.8 /100 | #161 | Good 97.6% |
| Bermudans | 60.5 /100 | #162 | Good 97.6% |
| Immigrants | Iran | 60.3 /100 | #163 | Good 97.6% |
| Ugandans | 58.9 /100 | #164 | Average 97.6% |
| Venezuelans | 58.7 /100 | #165 | Average 97.6% |
| Kenyans | 56.5 /100 | #166 | Average 97.5% |
| Immigrants | Poland | 55.9 /100 | #167 | Average 97.5% |
| Immigrants | Belarus | 55.8 /100 | #168 | Average 97.5% |
| Chileans | 54.4 /100 | #169 | Average 97.5% |
| Immigrants | Spain | 51.8 /100 | #170 | Average 97.5% |
| Brazilians | 51.5 /100 | #171 | Average 97.5% |
| Immigrants | Sri Lanka | 51.1 /100 | #172 | Average 97.5% |
| Immigrants | Korea | 50.6 /100 | #173 | Average 97.5% |
| Egyptians | 50.0 /100 | #174 | Average 97.5% |
| Immigrants | Micronesia | 49.6 /100 | #175 | Average 97.5% |
| Arabs | 48.7 /100 | #176 | Average 97.5% |
| Immigrants | Brazil | 46.1 /100 | #177 | Average 97.5% |
| Comanche | 45.3 /100 | #178 | Average 97.5% |
| Immigrants | Kazakhstan | 43.6 /100 | #179 | Average 97.5% |