Immigrants from Sri Lanka vs Colombian 4th Grade
COMPARE
Immigrants from Sri Lanka
Colombian
4th Grade
4th Grade Comparison
Immigrants from Sri Lanka
Colombians
97.5%
4TH GRADE
51.1/ 100
METRIC RATING
172nd/ 347
METRIC RANK
97.1%
4TH GRADE
1.6/ 100
METRIC RATING
240th/ 347
METRIC RANK
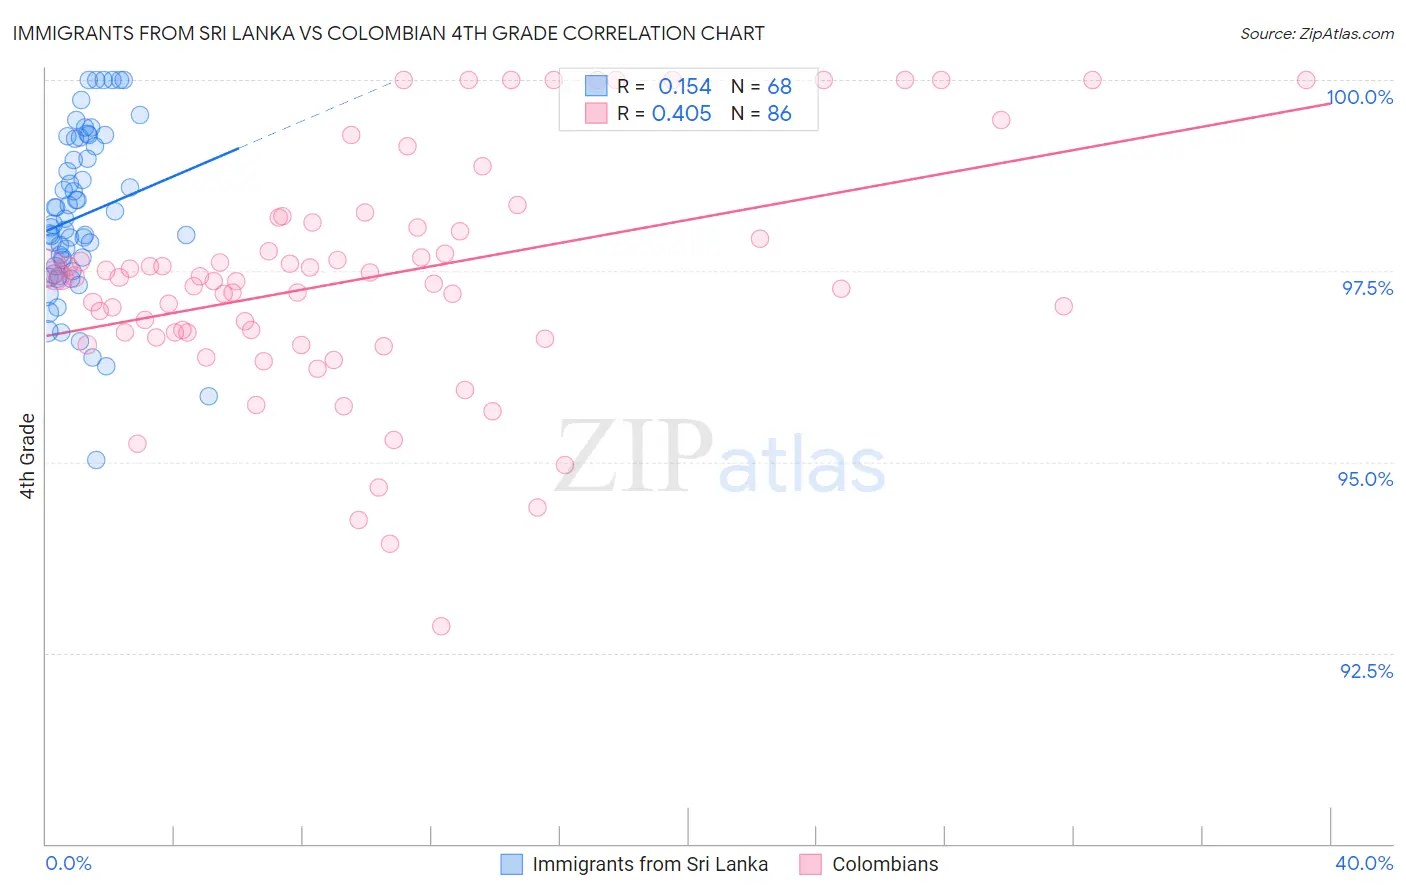
Immigrants from Sri Lanka vs Colombian 4th Grade Correlation Chart
The statistical analysis conducted on geographies consisting of 149,660,761 people shows a poor positive correlation between the proportion of Immigrants from Sri Lanka and percentage of population with at least 4th grade education in the United States with a correlation coefficient (R) of 0.154 and weighted average of 97.5%. Similarly, the statistical analysis conducted on geographies consisting of 419,700,680 people shows a moderate positive correlation between the proportion of Colombians and percentage of population with at least 4th grade education in the United States with a correlation coefficient (R) of 0.405 and weighted average of 97.1%, a difference of 0.39%.
4th Grade Correlation Summary
| Measurement | Immigrants from Sri Lanka | Colombian |
| Minimum | 95.0% | 92.9% |
| Maximum | 100.0% | 100.0% |
| Range | 5.0% | 7.1% |
| Mean | 98.2% | 97.4% |
| Median | 98.1% | 97.4% |
| Interquartile 25% (IQ1) | 97.5% | 96.7% |
| Interquartile 75% (IQ3) | 99.2% | 98.1% |
| Interquartile Range (IQR) | 1.7% | 1.4% |
| Standard Deviation (Sample) | 1.1% | 1.5% |
| Standard Deviation (Population) | 1.1% | 1.5% |
Similar Demographics by 4th Grade
Demographics Similar to Immigrants from Sri Lanka by 4th Grade
In terms of 4th grade, the demographic groups most similar to Immigrants from Sri Lanka are Immigrants from Spain (97.5%, a difference of 0.0%), Brazilian (97.5%, a difference of 0.0%), Immigrants from Korea (97.5%, a difference of 0.0%), Egyptian (97.5%, a difference of 0.0%), and Chilean (97.5%, a difference of 0.010%).
| Demographics | Rating | Rank | 4th Grade |
| Venezuelans | 58.7 /100 | #165 | Average 97.6% |
| Kenyans | 56.5 /100 | #166 | Average 97.5% |
| Immigrants | Poland | 55.9 /100 | #167 | Average 97.5% |
| Immigrants | Belarus | 55.8 /100 | #168 | Average 97.5% |
| Chileans | 54.4 /100 | #169 | Average 97.5% |
| Immigrants | Spain | 51.8 /100 | #170 | Average 97.5% |
| Brazilians | 51.5 /100 | #171 | Average 97.5% |
| Immigrants | Sri Lanka | 51.1 /100 | #172 | Average 97.5% |
| Immigrants | Korea | 50.6 /100 | #173 | Average 97.5% |
| Egyptians | 50.0 /100 | #174 | Average 97.5% |
| Immigrants | Micronesia | 49.6 /100 | #175 | Average 97.5% |
| Arabs | 48.7 /100 | #176 | Average 97.5% |
| Immigrants | Brazil | 46.1 /100 | #177 | Average 97.5% |
| Comanche | 45.3 /100 | #178 | Average 97.5% |
| Immigrants | Kazakhstan | 43.6 /100 | #179 | Average 97.5% |
Demographics Similar to Colombians by 4th Grade
In terms of 4th grade, the demographic groups most similar to Colombians are Immigrants from Indonesia (97.1%, a difference of 0.0%), Nigerian (97.1%, a difference of 0.010%), Asian (97.1%, a difference of 0.010%), Immigrants from Costa Rica (97.2%, a difference of 0.020%), and Indian (Asian) (97.2%, a difference of 0.020%).
| Demographics | Rating | Rank | 4th Grade |
| Senegalese | 3.1 /100 | #233 | Tragic 97.2% |
| Assyrians/Chaldeans/Syriacs | 3.0 /100 | #234 | Tragic 97.2% |
| Yuman | 2.9 /100 | #235 | Tragic 97.2% |
| Immigrants | Eastern Asia | 2.7 /100 | #236 | Tragic 97.2% |
| Immigrants | Costa Rica | 2.0 /100 | #237 | Tragic 97.2% |
| Indians (Asian) | 1.9 /100 | #238 | Tragic 97.2% |
| Nigerians | 1.8 /100 | #239 | Tragic 97.1% |
| Colombians | 1.6 /100 | #240 | Tragic 97.1% |
| Immigrants | Indonesia | 1.5 /100 | #241 | Tragic 97.1% |
| Asians | 1.4 /100 | #242 | Tragic 97.1% |
| U.S. Virgin Islanders | 1.4 /100 | #243 | Tragic 97.1% |
| Koreans | 1.3 /100 | #244 | Tragic 97.1% |
| Immigrants | Eastern Africa | 1.2 /100 | #245 | Tragic 97.1% |
| Immigrants | Uruguay | 1.2 /100 | #246 | Tragic 97.1% |
| Ethiopians | 1.2 /100 | #247 | Tragic 97.1% |