Immigrants from Spain vs Immigrants from Africa Master's Degree
COMPARE
Immigrants from Spain
Immigrants from Africa
Master's Degree
Master's Degree Comparison
Immigrants from Spain
Immigrants from Africa
19.1%
MASTER'S DEGREE
100.0/ 100
METRIC RATING
39th/ 347
METRIC RANK
15.7%
MASTER'S DEGREE
84.0/ 100
METRIC RATING
142nd/ 347
METRIC RANK
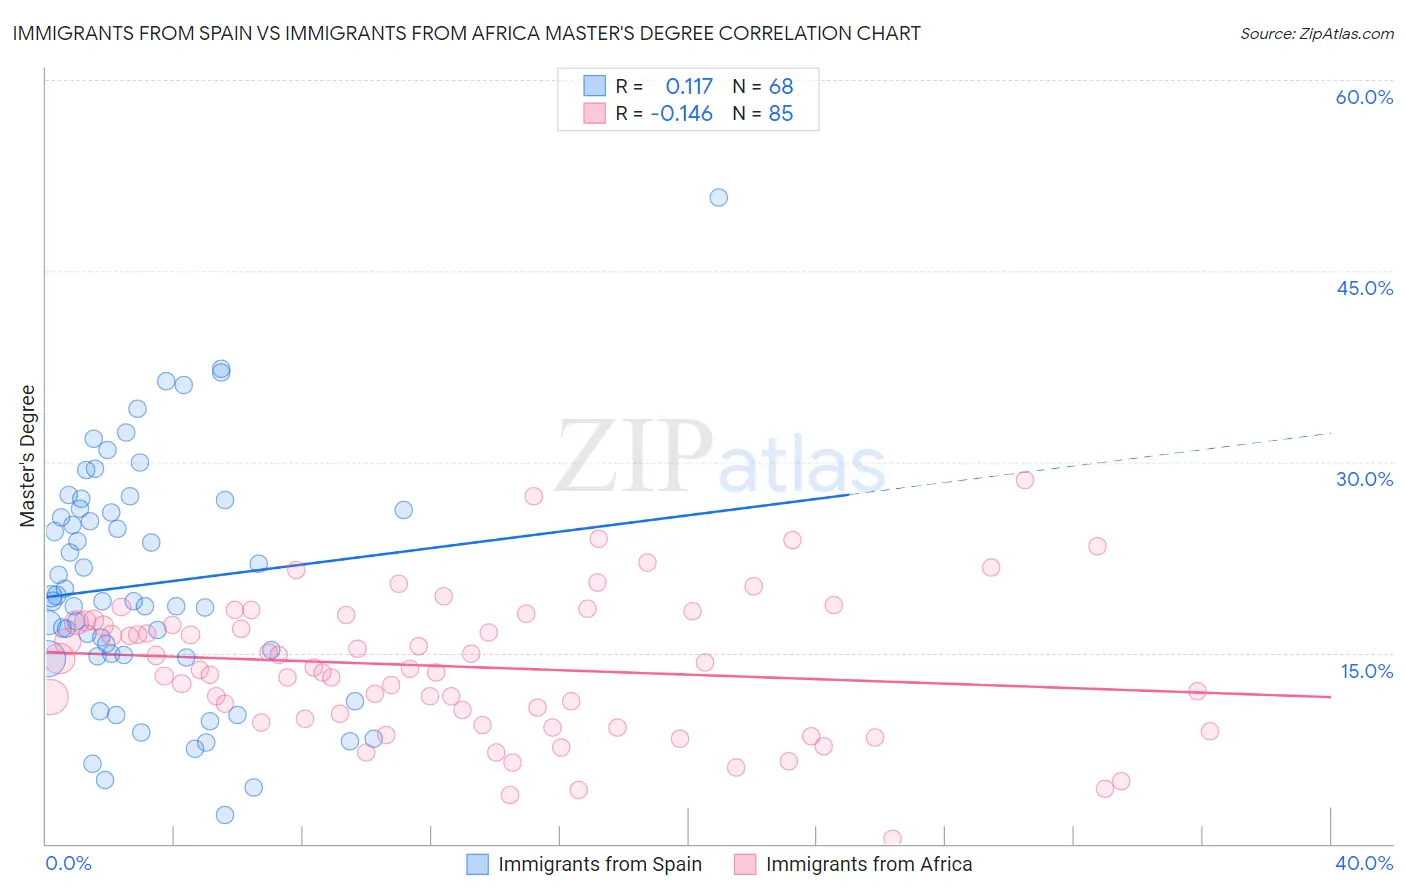
Immigrants from Spain vs Immigrants from Africa Master's Degree Correlation Chart
The statistical analysis conducted on geographies consisting of 239,658,516 people shows a poor positive correlation between the proportion of Immigrants from Spain and percentage of population with at least master's degree education in the United States with a correlation coefficient (R) of 0.117 and weighted average of 19.1%. Similarly, the statistical analysis conducted on geographies consisting of 469,202,682 people shows a poor negative correlation between the proportion of Immigrants from Africa and percentage of population with at least master's degree education in the United States with a correlation coefficient (R) of -0.146 and weighted average of 15.7%, a difference of 21.8%.
Master's Degree Correlation Summary
| Measurement | Immigrants from Spain | Immigrants from Africa |
| Minimum | 2.2% | 0.40% |
| Maximum | 50.8% | 28.6% |
| Range | 48.5% | 28.2% |
| Mean | 20.4% | 13.9% |
| Median | 19.0% | 13.7% |
| Interquartile 25% (IQ1) | 14.8% | 9.7% |
| Interquartile 75% (IQ3) | 26.3% | 17.5% |
| Interquartile Range (IQR) | 11.5% | 7.9% |
| Standard Deviation (Sample) | 9.3% | 5.5% |
| Standard Deviation (Population) | 9.3% | 5.5% |
Similar Demographics by Master's Degree
Demographics Similar to Immigrants from Spain by Master's Degree
In terms of master's degree, the demographic groups most similar to Immigrants from Spain are Immigrants from Bolivia (19.1%, a difference of 0.13%), Immigrants from Latvia (19.1%, a difference of 0.47%), Bolivian (19.3%, a difference of 0.64%), Immigrants from Saudi Arabia (19.0%, a difference of 0.91%), and Immigrants from Greece (19.0%, a difference of 0.92%).
| Demographics | Rating | Rank | Master's Degree |
| Burmese | 100.0 /100 | #32 | Exceptional 19.7% |
| Russians | 100.0 /100 | #33 | Exceptional 19.5% |
| Immigrants | Denmark | 100.0 /100 | #34 | Exceptional 19.5% |
| Immigrants | Northern Europe | 100.0 /100 | #35 | Exceptional 19.5% |
| Immigrants | Russia | 100.0 /100 | #36 | Exceptional 19.4% |
| Mongolians | 100.0 /100 | #37 | Exceptional 19.4% |
| Bolivians | 100.0 /100 | #38 | Exceptional 19.3% |
| Immigrants | Spain | 100.0 /100 | #39 | Exceptional 19.1% |
| Immigrants | Bolivia | 100.0 /100 | #40 | Exceptional 19.1% |
| Immigrants | Latvia | 100.0 /100 | #41 | Exceptional 19.1% |
| Immigrants | Saudi Arabia | 100.0 /100 | #42 | Exceptional 19.0% |
| Immigrants | Greece | 100.0 /100 | #43 | Exceptional 19.0% |
| Immigrants | Malaysia | 100.0 /100 | #44 | Exceptional 18.9% |
| Immigrants | Belarus | 100.0 /100 | #45 | Exceptional 18.9% |
| Immigrants | Norway | 100.0 /100 | #46 | Exceptional 18.8% |
Demographics Similar to Immigrants from Africa by Master's Degree
In terms of master's degree, the demographic groups most similar to Immigrants from Africa are Immigrants from Venezuela (15.7%, a difference of 0.090%), Canadian (15.7%, a difference of 0.17%), Polish (15.7%, a difference of 0.23%), Vietnamese (15.8%, a difference of 0.36%), and Immigrants from Germany (15.8%, a difference of 0.44%).
| Demographics | Rating | Rank | Master's Degree |
| South American Indians | 88.4 /100 | #135 | Excellent 15.9% |
| Assyrians/Chaldeans/Syriacs | 86.8 /100 | #136 | Excellent 15.8% |
| Europeans | 86.4 /100 | #137 | Excellent 15.8% |
| Pakistanis | 86.1 /100 | #138 | Excellent 15.8% |
| Immigrants | Germany | 85.9 /100 | #139 | Excellent 15.8% |
| Vietnamese | 85.5 /100 | #140 | Excellent 15.8% |
| Poles | 85.0 /100 | #141 | Excellent 15.7% |
| Immigrants | Africa | 84.0 /100 | #142 | Excellent 15.7% |
| Immigrants | Venezuela | 83.6 /100 | #143 | Excellent 15.7% |
| Canadians | 83.3 /100 | #144 | Excellent 15.7% |
| South Americans | 81.3 /100 | #145 | Excellent 15.6% |
| Immigrants | Afghanistan | 79.4 /100 | #146 | Good 15.6% |
| Hungarians | 79.1 /100 | #147 | Good 15.6% |
| Immigrants | Senegal | 78.2 /100 | #148 | Good 15.5% |
| Ghanaians | 78.2 /100 | #149 | Good 15.5% |