Immigrants from Spain vs Portuguese 10th Grade
COMPARE
Immigrants from Spain
Portuguese
10th Grade
10th Grade Comparison
Immigrants from Spain
Portuguese
93.8%
10TH GRADE
55.9/ 100
METRIC RATING
169th/ 347
METRIC RANK
93.3%
10TH GRADE
12.1/ 100
METRIC RATING
217th/ 347
METRIC RANK
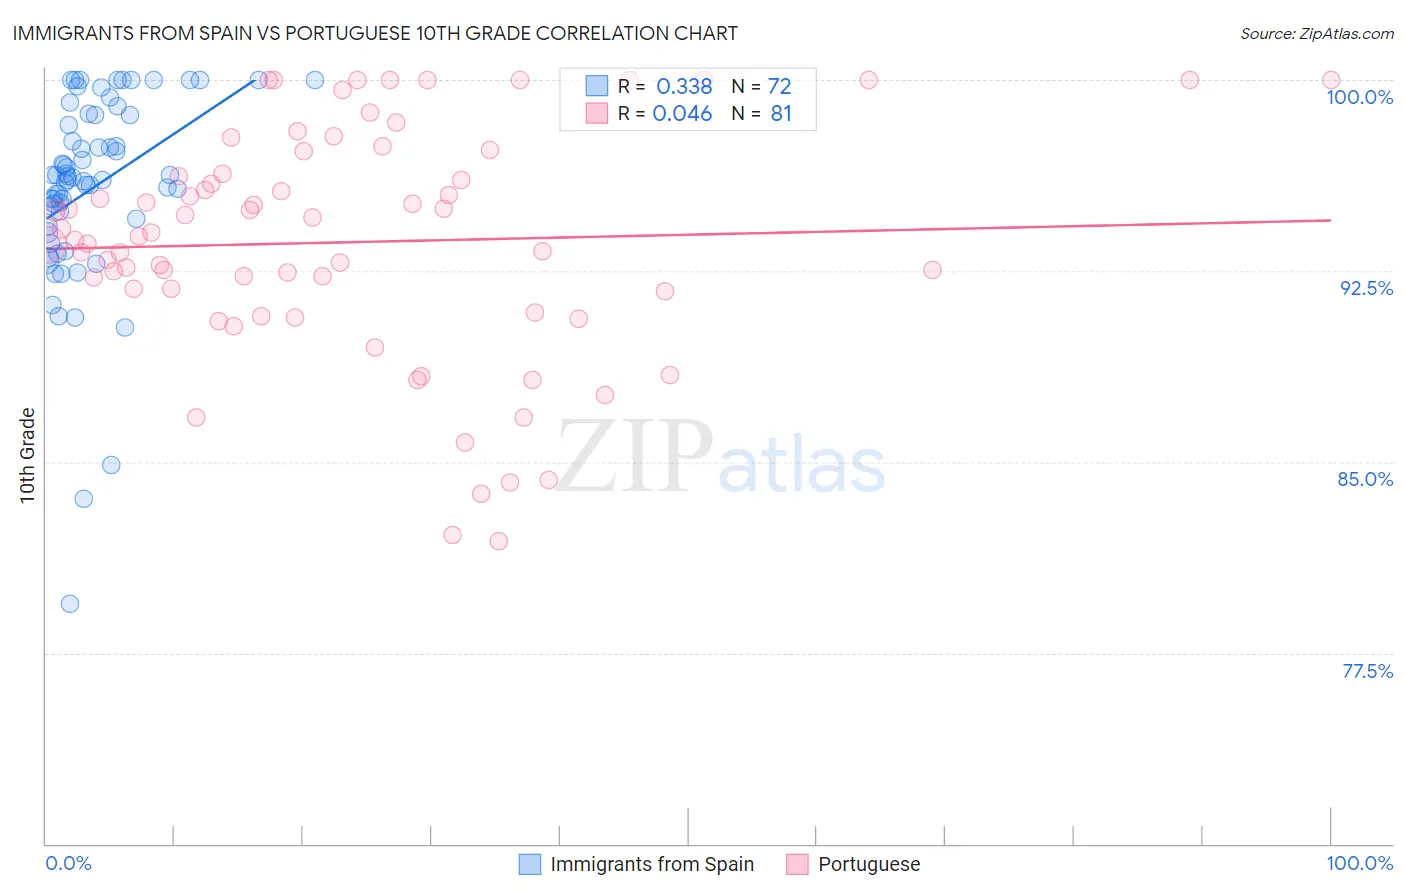
Immigrants from Spain vs Portuguese 10th Grade Correlation Chart
The statistical analysis conducted on geographies consisting of 239,682,725 people shows a mild positive correlation between the proportion of Immigrants from Spain and percentage of population with at least 10th grade education in the United States with a correlation coefficient (R) of 0.338 and weighted average of 93.8%. Similarly, the statistical analysis conducted on geographies consisting of 450,343,001 people shows no correlation between the proportion of Portuguese and percentage of population with at least 10th grade education in the United States with a correlation coefficient (R) of 0.046 and weighted average of 93.3%, a difference of 0.50%.
10th Grade Correlation Summary
| Measurement | Immigrants from Spain | Portuguese |
| Minimum | 79.4% | 81.9% |
| Maximum | 100.0% | 100.0% |
| Range | 20.6% | 18.1% |
| Mean | 95.7% | 93.6% |
| Median | 96.1% | 93.9% |
| Interquartile 25% (IQ1) | 94.4% | 91.3% |
| Interquartile 75% (IQ3) | 98.6% | 96.8% |
| Interquartile Range (IQR) | 4.2% | 5.5% |
| Standard Deviation (Sample) | 3.8% | 4.5% |
| Standard Deviation (Population) | 3.8% | 4.5% |
Similar Demographics by 10th Grade
Demographics Similar to Immigrants from Spain by 10th Grade
In terms of 10th grade, the demographic groups most similar to Immigrants from Spain are Immigrants from Venezuela (93.8%, a difference of 0.020%), Alsatian (93.8%, a difference of 0.030%), Immigrants from Albania (93.8%, a difference of 0.030%), French American Indian (93.7%, a difference of 0.050%), and Spaniard (93.7%, a difference of 0.050%).
| Demographics | Rating | Rank | 10th Grade |
| Immigrants | Poland | 69.6 /100 | #162 | Good 93.9% |
| Venezuelans | 69.5 /100 | #163 | Good 93.9% |
| Iraqis | 68.1 /100 | #164 | Good 93.9% |
| Brazilians | 63.6 /100 | #165 | Good 93.8% |
| Immigrants | Iraq | 63.0 /100 | #166 | Good 93.8% |
| Immigrants | Egypt | 62.3 /100 | #167 | Good 93.8% |
| Alsatians | 59.4 /100 | #168 | Average 93.8% |
| Immigrants | Spain | 55.9 /100 | #169 | Average 93.8% |
| Immigrants | Venezuela | 53.9 /100 | #170 | Average 93.8% |
| Immigrants | Albania | 52.4 /100 | #171 | Average 93.8% |
| French American Indians | 50.9 /100 | #172 | Average 93.7% |
| Spaniards | 50.3 /100 | #173 | Average 93.7% |
| Argentineans | 50.0 /100 | #174 | Average 93.7% |
| Immigrants | Nepal | 49.6 /100 | #175 | Average 93.7% |
| Immigrants | Argentina | 47.1 /100 | #176 | Average 93.7% |
Demographics Similar to Portuguese by 10th Grade
In terms of 10th grade, the demographic groups most similar to Portuguese are Immigrants from Liberia (93.3%, a difference of 0.040%), Seminole (93.3%, a difference of 0.040%), Immigrants from Eastern Africa (93.4%, a difference of 0.050%), Immigrants from Bahamas (93.4%, a difference of 0.060%), and Immigrants from Oceania (93.4%, a difference of 0.060%).
| Demographics | Rating | Rank | 10th Grade |
| Indians (Asian) | 17.6 /100 | #210 | Poor 93.4% |
| Cajuns | 16.9 /100 | #211 | Poor 93.4% |
| Immigrants | Zaire | 16.7 /100 | #212 | Poor 93.4% |
| Immigrants | Asia | 15.7 /100 | #213 | Poor 93.4% |
| Immigrants | Bahamas | 15.2 /100 | #214 | Poor 93.4% |
| Immigrants | Oceania | 15.1 /100 | #215 | Poor 93.4% |
| Immigrants | Eastern Africa | 14.7 /100 | #216 | Poor 93.4% |
| Portuguese | 12.1 /100 | #217 | Poor 93.3% |
| Immigrants | Liberia | 10.2 /100 | #218 | Poor 93.3% |
| Seminole | 10.2 /100 | #219 | Poor 93.3% |
| Tongans | 9.5 /100 | #220 | Tragic 93.3% |
| Immigrants | Southern Europe | 8.9 /100 | #221 | Tragic 93.2% |
| Ethiopians | 7.9 /100 | #222 | Tragic 93.2% |
| Immigrants | Sierra Leone | 7.6 /100 | #223 | Tragic 93.2% |
| Bolivians | 6.7 /100 | #224 | Tragic 93.2% |