Immigrants from Spain vs Mexican 10th Grade
COMPARE
Immigrants from Spain
Mexican
10th Grade
10th Grade Comparison
Immigrants from Spain
Mexicans
93.8%
10TH GRADE
55.9/ 100
METRIC RATING
169th/ 347
METRIC RANK
87.8%
10TH GRADE
0.0/ 100
METRIC RATING
340th/ 347
METRIC RANK
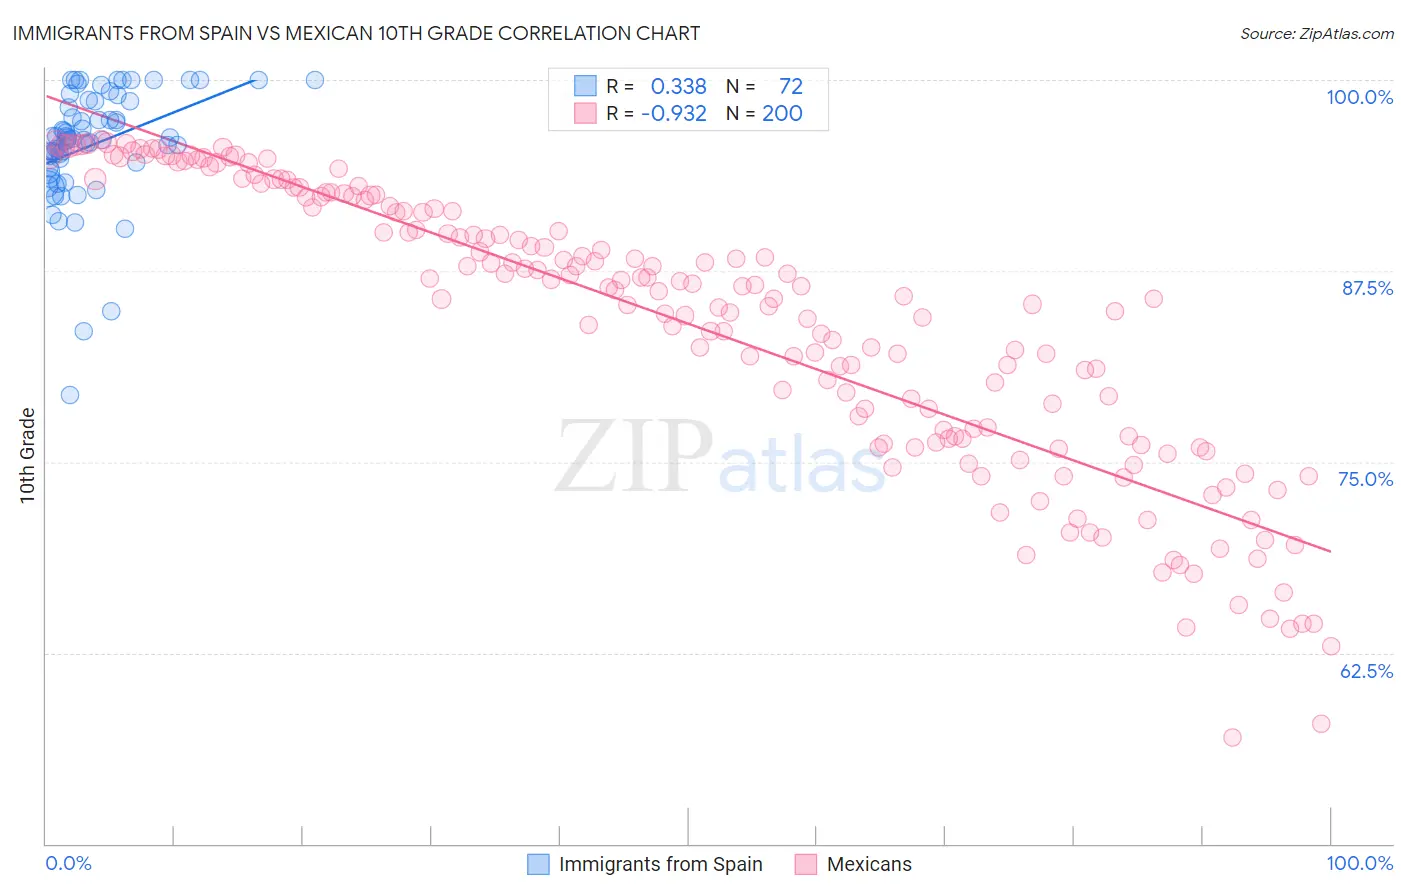
Immigrants from Spain vs Mexican 10th Grade Correlation Chart
The statistical analysis conducted on geographies consisting of 239,682,725 people shows a mild positive correlation between the proportion of Immigrants from Spain and percentage of population with at least 10th grade education in the United States with a correlation coefficient (R) of 0.338 and weighted average of 93.8%. Similarly, the statistical analysis conducted on geographies consisting of 565,338,990 people shows a near-perfect negative correlation between the proportion of Mexicans and percentage of population with at least 10th grade education in the United States with a correlation coefficient (R) of -0.932 and weighted average of 87.8%, a difference of 6.9%.
10th Grade Correlation Summary
| Measurement | Immigrants from Spain | Mexican |
| Minimum | 79.4% | 57.0% |
| Maximum | 100.0% | 96.1% |
| Range | 20.6% | 39.1% |
| Mean | 95.7% | 84.0% |
| Median | 96.1% | 86.3% |
| Interquartile 25% (IQ1) | 94.4% | 76.6% |
| Interquartile 75% (IQ3) | 98.6% | 92.3% |
| Interquartile Range (IQR) | 4.2% | 15.7% |
| Standard Deviation (Sample) | 3.8% | 9.3% |
| Standard Deviation (Population) | 3.8% | 9.2% |
Similar Demographics by 10th Grade
Demographics Similar to Immigrants from Spain by 10th Grade
In terms of 10th grade, the demographic groups most similar to Immigrants from Spain are Immigrants from Venezuela (93.8%, a difference of 0.020%), Alsatian (93.8%, a difference of 0.030%), Immigrants from Albania (93.8%, a difference of 0.030%), French American Indian (93.7%, a difference of 0.050%), and Spaniard (93.7%, a difference of 0.050%).
| Demographics | Rating | Rank | 10th Grade |
| Immigrants | Poland | 69.6 /100 | #162 | Good 93.9% |
| Venezuelans | 69.5 /100 | #163 | Good 93.9% |
| Iraqis | 68.1 /100 | #164 | Good 93.9% |
| Brazilians | 63.6 /100 | #165 | Good 93.8% |
| Immigrants | Iraq | 63.0 /100 | #166 | Good 93.8% |
| Immigrants | Egypt | 62.3 /100 | #167 | Good 93.8% |
| Alsatians | 59.4 /100 | #168 | Average 93.8% |
| Immigrants | Spain | 55.9 /100 | #169 | Average 93.8% |
| Immigrants | Venezuela | 53.9 /100 | #170 | Average 93.8% |
| Immigrants | Albania | 52.4 /100 | #171 | Average 93.8% |
| French American Indians | 50.9 /100 | #172 | Average 93.7% |
| Spaniards | 50.3 /100 | #173 | Average 93.7% |
| Argentineans | 50.0 /100 | #174 | Average 93.7% |
| Immigrants | Nepal | 49.6 /100 | #175 | Average 93.7% |
| Immigrants | Argentina | 47.1 /100 | #176 | Average 93.7% |
Demographics Similar to Mexicans by 10th Grade
In terms of 10th grade, the demographic groups most similar to Mexicans are Guatemalan (87.9%, a difference of 0.16%), Salvadoran (87.5%, a difference of 0.29%), Immigrants from Guatemala (87.4%, a difference of 0.44%), Immigrants from Latin America (88.3%, a difference of 0.65%), and Central American (88.4%, a difference of 0.71%).
| Demographics | Rating | Rank | 10th Grade |
| Hondurans | 0.0 /100 | #333 | Tragic 89.0% |
| Hispanics or Latinos | 0.0 /100 | #334 | Tragic 88.9% |
| Immigrants | Dominican Republic | 0.0 /100 | #335 | Tragic 88.7% |
| Immigrants | Honduras | 0.0 /100 | #336 | Tragic 88.5% |
| Central Americans | 0.0 /100 | #337 | Tragic 88.4% |
| Immigrants | Latin America | 0.0 /100 | #338 | Tragic 88.3% |
| Guatemalans | 0.0 /100 | #339 | Tragic 87.9% |
| Mexicans | 0.0 /100 | #340 | Tragic 87.8% |
| Salvadorans | 0.0 /100 | #341 | Tragic 87.5% |
| Immigrants | Guatemala | 0.0 /100 | #342 | Tragic 87.4% |
| Yakama | 0.0 /100 | #343 | Tragic 86.9% |
| Immigrants | El Salvador | 0.0 /100 | #344 | Tragic 86.8% |
| Immigrants | Central America | 0.0 /100 | #345 | Tragic 86.6% |
| Spanish American Indians | 0.0 /100 | #346 | Tragic 86.2% |
| Immigrants | Mexico | 0.0 /100 | #347 | Tragic 86.2% |