Immigrants from Spain vs Nonimmigrants 10th Grade
COMPARE
Immigrants from Spain
Nonimmigrants
10th Grade
10th Grade Comparison
Immigrants from Spain
Nonimmigrants
93.8%
10TH GRADE
55.9/ 100
METRIC RATING
169th/ 347
METRIC RANK
94.1%
10TH GRADE
83.8/ 100
METRIC RATING
145th/ 347
METRIC RANK
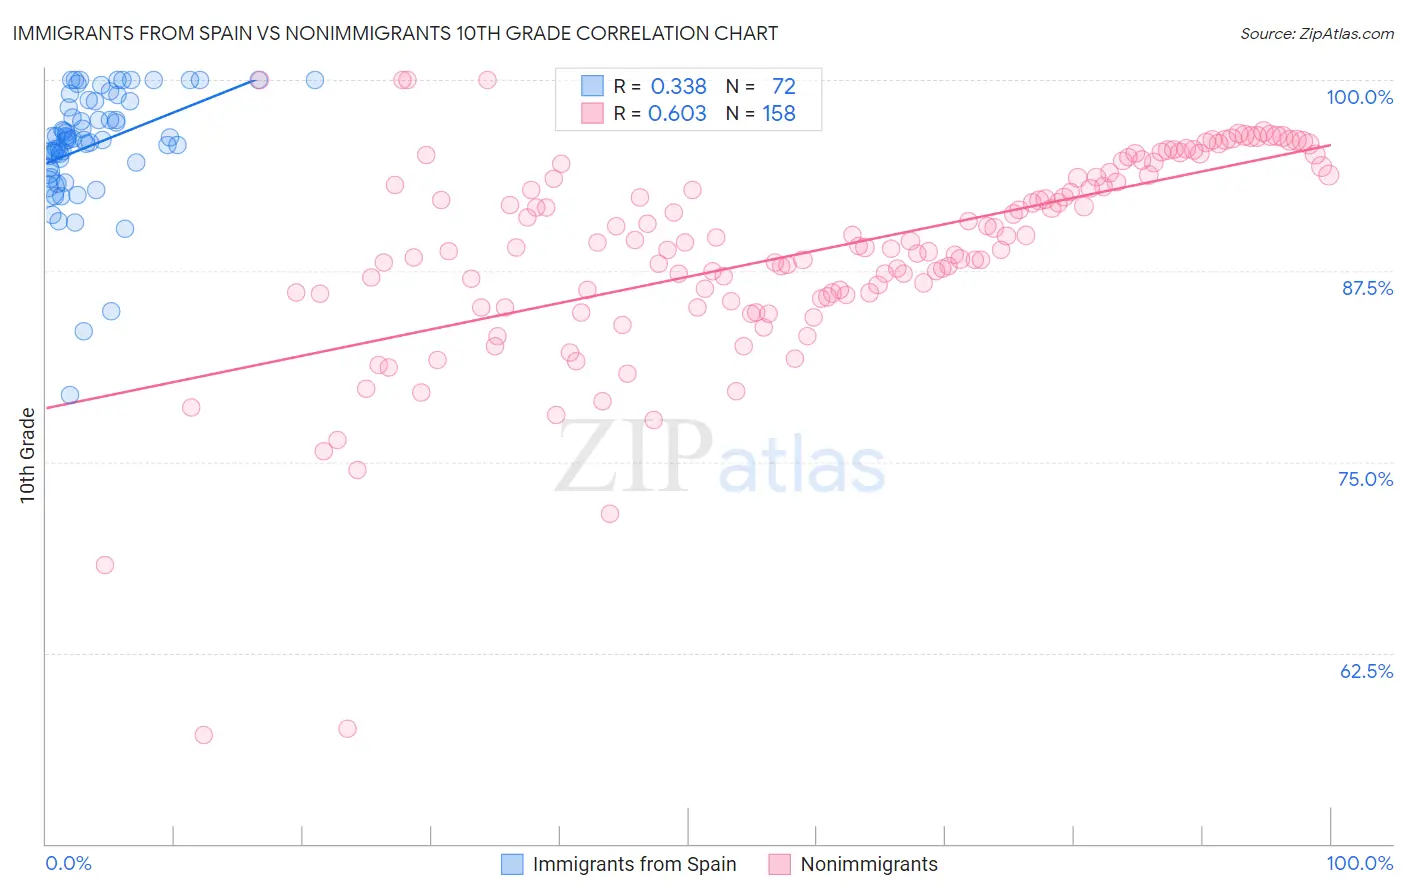
Immigrants from Spain vs Nonimmigrants 10th Grade Correlation Chart
The statistical analysis conducted on geographies consisting of 239,682,725 people shows a mild positive correlation between the proportion of Immigrants from Spain and percentage of population with at least 10th grade education in the United States with a correlation coefficient (R) of 0.338 and weighted average of 93.8%. Similarly, the statistical analysis conducted on geographies consisting of 585,371,970 people shows a significant positive correlation between the proportion of Nonimmigrants and percentage of population with at least 10th grade education in the United States with a correlation coefficient (R) of 0.603 and weighted average of 94.1%, a difference of 0.31%.
10th Grade Correlation Summary
| Measurement | Immigrants from Spain | Nonimmigrants |
| Minimum | 79.4% | 57.2% |
| Maximum | 100.0% | 100.0% |
| Range | 20.6% | 42.8% |
| Mean | 95.7% | 88.9% |
| Median | 96.1% | 89.2% |
| Interquartile 25% (IQ1) | 94.4% | 86.0% |
| Interquartile 75% (IQ3) | 98.6% | 93.8% |
| Interquartile Range (IQR) | 4.2% | 7.8% |
| Standard Deviation (Sample) | 3.8% | 6.8% |
| Standard Deviation (Population) | 3.8% | 6.8% |
Similar Demographics by 10th Grade
Demographics Similar to Immigrants from Spain by 10th Grade
In terms of 10th grade, the demographic groups most similar to Immigrants from Spain are Immigrants from Venezuela (93.8%, a difference of 0.020%), Alsatian (93.8%, a difference of 0.030%), Immigrants from Albania (93.8%, a difference of 0.030%), French American Indian (93.7%, a difference of 0.050%), and Spaniard (93.7%, a difference of 0.050%).
| Demographics | Rating | Rank | 10th Grade |
| Immigrants | Poland | 69.6 /100 | #162 | Good 93.9% |
| Venezuelans | 69.5 /100 | #163 | Good 93.9% |
| Iraqis | 68.1 /100 | #164 | Good 93.9% |
| Brazilians | 63.6 /100 | #165 | Good 93.8% |
| Immigrants | Iraq | 63.0 /100 | #166 | Good 93.8% |
| Immigrants | Egypt | 62.3 /100 | #167 | Good 93.8% |
| Alsatians | 59.4 /100 | #168 | Average 93.8% |
| Immigrants | Spain | 55.9 /100 | #169 | Average 93.8% |
| Immigrants | Venezuela | 53.9 /100 | #170 | Average 93.8% |
| Immigrants | Albania | 52.4 /100 | #171 | Average 93.8% |
| French American Indians | 50.9 /100 | #172 | Average 93.7% |
| Spaniards | 50.3 /100 | #173 | Average 93.7% |
| Argentineans | 50.0 /100 | #174 | Average 93.7% |
| Immigrants | Nepal | 49.6 /100 | #175 | Average 93.7% |
| Immigrants | Argentina | 47.1 /100 | #176 | Average 93.7% |
Demographics Similar to Nonimmigrants by 10th Grade
In terms of 10th grade, the demographic groups most similar to Nonimmigrants are Cherokee (94.1%, a difference of 0.020%), Immigrants from Kazakhstan (94.1%, a difference of 0.020%), Chickasaw (94.1%, a difference of 0.020%), Immigrants from Ukraine (94.0%, a difference of 0.040%), and Arab (94.0%, a difference of 0.040%).
| Demographics | Rating | Rank | 10th Grade |
| Immigrants | Sri Lanka | 89.9 /100 | #138 | Excellent 94.2% |
| Immigrants | Bosnia and Herzegovina | 89.4 /100 | #139 | Excellent 94.2% |
| Immigrants | Jordan | 87.6 /100 | #140 | Excellent 94.1% |
| Hmong | 86.6 /100 | #141 | Excellent 94.1% |
| Albanians | 86.5 /100 | #142 | Excellent 94.1% |
| Cherokee | 84.9 /100 | #143 | Excellent 94.1% |
| Immigrants | Kazakhstan | 84.9 /100 | #144 | Excellent 94.1% |
| Immigrants | Nonimmigrants | 83.8 /100 | #145 | Excellent 94.1% |
| Chickasaw | 82.6 /100 | #146 | Excellent 94.1% |
| Immigrants | Ukraine | 81.5 /100 | #147 | Excellent 94.0% |
| Arabs | 80.9 /100 | #148 | Excellent 94.0% |
| Ugandans | 80.7 /100 | #149 | Excellent 94.0% |
| Egyptians | 79.6 /100 | #150 | Good 94.0% |
| Kenyans | 79.1 /100 | #151 | Good 94.0% |
| Immigrants | Italy | 78.0 /100 | #152 | Good 94.0% |