Immigrants from Spain vs Northern European 6th Grade
COMPARE
Immigrants from Spain
Northern European
6th Grade
6th Grade Comparison
Immigrants from Spain
Northern Europeans
97.0%
6TH GRADE
39.9/ 100
METRIC RATING
180th/ 347
METRIC RANK
97.8%
6TH GRADE
99.9/ 100
METRIC RATING
43rd/ 347
METRIC RANK
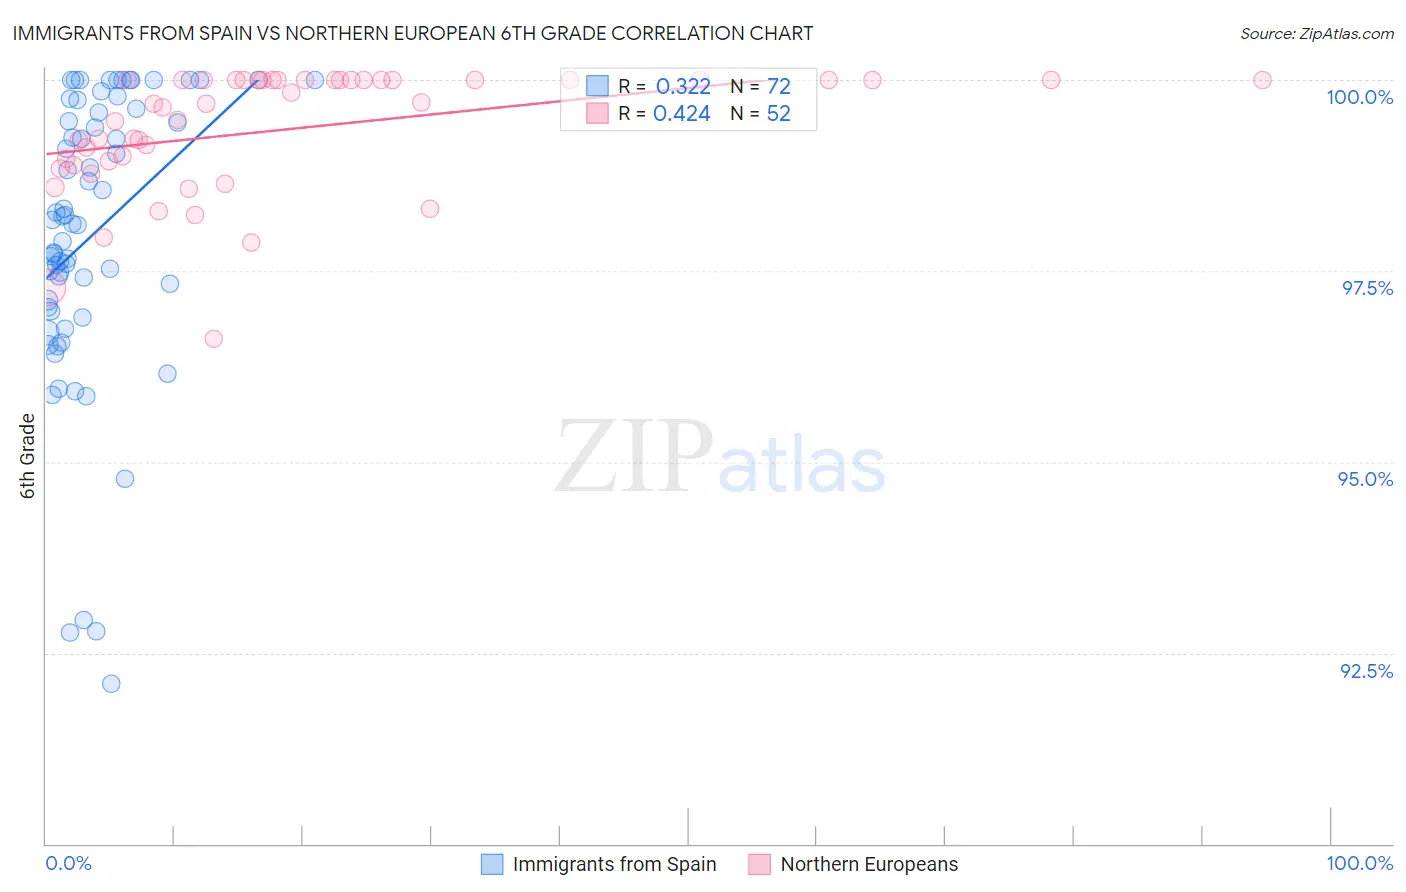
Immigrants from Spain vs Northern European 6th Grade Correlation Chart
The statistical analysis conducted on geographies consisting of 239,682,725 people shows a mild positive correlation between the proportion of Immigrants from Spain and percentage of population with at least 6th grade education in the United States with a correlation coefficient (R) of 0.322 and weighted average of 97.0%. Similarly, the statistical analysis conducted on geographies consisting of 406,093,361 people shows a moderate positive correlation between the proportion of Northern Europeans and percentage of population with at least 6th grade education in the United States with a correlation coefficient (R) of 0.424 and weighted average of 97.8%, a difference of 0.86%.
6th Grade Correlation Summary
| Measurement | Immigrants from Spain | Northern European |
| Minimum | 92.1% | 96.6% |
| Maximum | 100.0% | 100.0% |
| Range | 7.9% | 3.4% |
| Mean | 98.0% | 99.4% |
| Median | 98.1% | 99.7% |
| Interquartile 25% (IQ1) | 97.0% | 98.9% |
| Interquartile 75% (IQ3) | 99.6% | 100.0% |
| Interquartile Range (IQR) | 2.6% | 1.1% |
| Standard Deviation (Sample) | 1.9% | 0.80% |
| Standard Deviation (Population) | 1.9% | 0.80% |
Similar Demographics by 6th Grade
Demographics Similar to Immigrants from Spain by 6th Grade
In terms of 6th grade, the demographic groups most similar to Immigrants from Spain are Comanche (97.0%, a difference of 0.010%), Immigrants from Ukraine (97.0%, a difference of 0.020%), Immigrants from Kazakhstan (97.0%, a difference of 0.030%), Immigrants from Micronesia (97.0%, a difference of 0.030%), and Mongolian (97.0%, a difference of 0.030%).
| Demographics | Rating | Rank | 6th Grade |
| Arabs | 50.1 /100 | #173 | Average 97.0% |
| Venezuelans | 50.0 /100 | #174 | Average 97.0% |
| Immigrants | Kazakhstan | 47.3 /100 | #175 | Average 97.0% |
| Immigrants | Micronesia | 47.1 /100 | #176 | Average 97.0% |
| Mongolians | 46.7 /100 | #177 | Average 97.0% |
| Pakistanis | 46.0 /100 | #178 | Average 97.0% |
| Immigrants | Kenya | 45.3 /100 | #179 | Average 97.0% |
| Immigrants | Spain | 39.9 /100 | #180 | Fair 97.0% |
| Comanche | 37.9 /100 | #181 | Fair 97.0% |
| Immigrants | Ukraine | 35.6 /100 | #182 | Fair 97.0% |
| Immigrants | Venezuela | 34.5 /100 | #183 | Fair 97.0% |
| Spanish Americans | 33.5 /100 | #184 | Fair 97.0% |
| Argentineans | 33.0 /100 | #185 | Fair 97.0% |
| Immigrants | Egypt | 31.4 /100 | #186 | Fair 97.0% |
| Guamanians/Chamorros | 30.6 /100 | #187 | Fair 97.0% |
Demographics Similar to Northern Europeans by 6th Grade
In terms of 6th grade, the demographic groups most similar to Northern Europeans are Hungarian (97.8%, a difference of 0.010%), Eastern European (97.9%, a difference of 0.020%), Czechoslovakian (97.8%, a difference of 0.030%), Latvian (97.9%, a difference of 0.050%), and Bulgarian (97.8%, a difference of 0.050%).
| Demographics | Rating | Rank | 6th Grade |
| Italians | 100.0 /100 | #36 | Exceptional 97.9% |
| British | 100.0 /100 | #37 | Exceptional 97.9% |
| Belgians | 100.0 /100 | #38 | Exceptional 97.9% |
| Luxembourgers | 99.9 /100 | #39 | Exceptional 97.9% |
| Latvians | 99.9 /100 | #40 | Exceptional 97.9% |
| Eastern Europeans | 99.9 /100 | #41 | Exceptional 97.9% |
| Hungarians | 99.9 /100 | #42 | Exceptional 97.8% |
| Northern Europeans | 99.9 /100 | #43 | Exceptional 97.8% |
| Czechoslovakians | 99.9 /100 | #44 | Exceptional 97.8% |
| Bulgarians | 99.9 /100 | #45 | Exceptional 97.8% |
| Arapaho | 99.9 /100 | #46 | Exceptional 97.8% |
| Native Hawaiians | 99.9 /100 | #47 | Exceptional 97.8% |
| Celtics | 99.9 /100 | #48 | Exceptional 97.8% |
| Estonians | 99.8 /100 | #49 | Exceptional 97.8% |
| Immigrants | Scotland | 99.8 /100 | #50 | Exceptional 97.8% |