Immigrants from Spain vs Northern European Unemployment Among Seniors over 75 years
COMPARE
Immigrants from Spain
Northern European
Unemployment Among Seniors over 75 years
Unemployment Among Seniors over 75 years Comparison
Immigrants from Spain
Northern Europeans
7.8%
UNEMPLOYMENT AMONG SENIORS OVER 75 YEARS
100.0/ 100
METRIC RATING
44th/ 347
METRIC RANK
9.1%
UNEMPLOYMENT AMONG SENIORS OVER 75 YEARS
4.9/ 100
METRIC RATING
230th/ 347
METRIC RANK
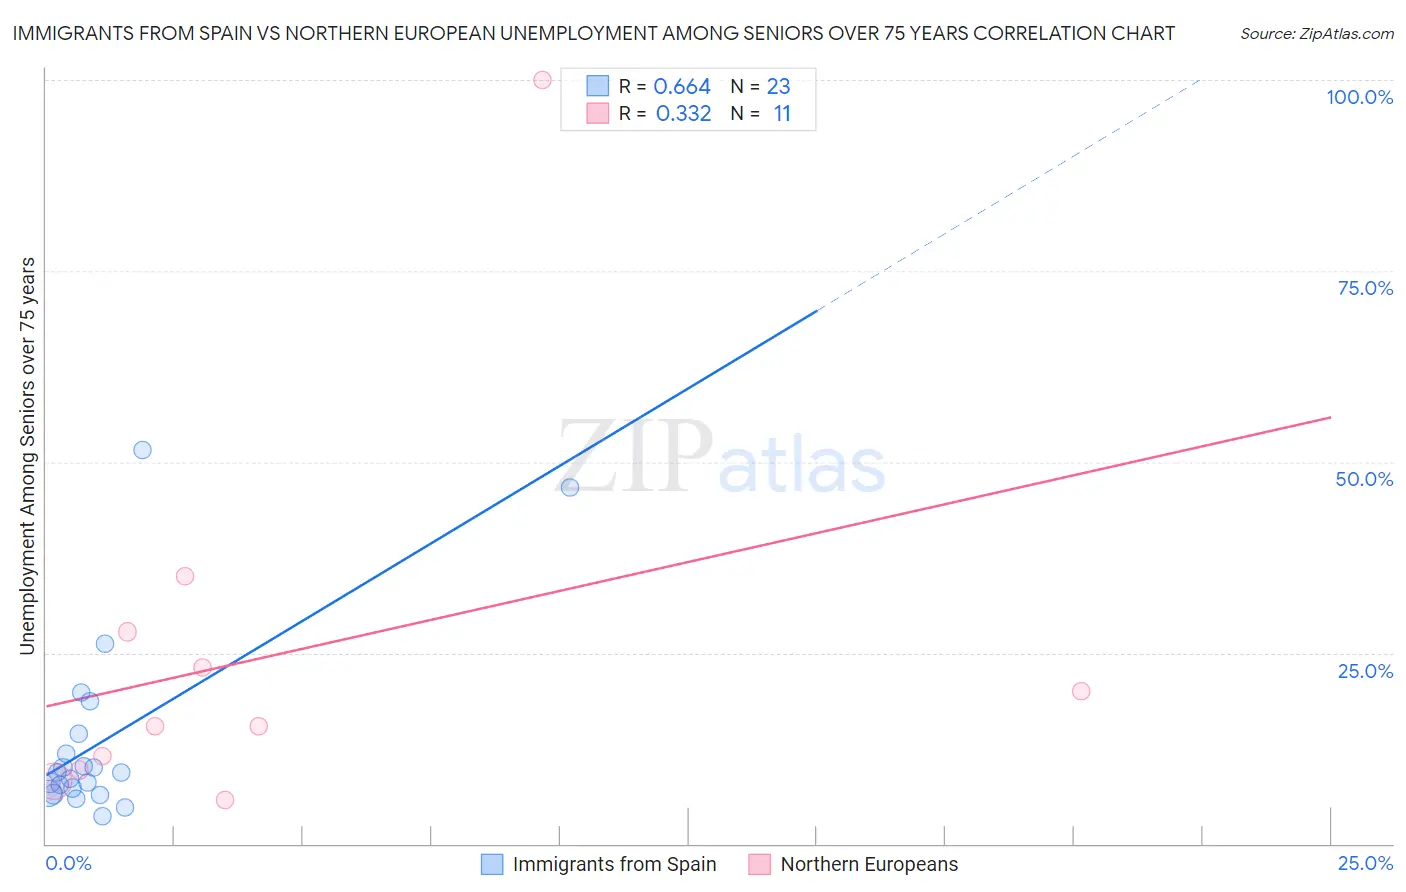
Immigrants from Spain vs Northern European Unemployment Among Seniors over 75 years Correlation Chart
The statistical analysis conducted on geographies consisting of 145,232,971 people shows a significant positive correlation between the proportion of Immigrants from Spain and unemployment rate among seniors over the age of 75 in the United States with a correlation coefficient (R) of 0.664 and weighted average of 7.8%. Similarly, the statistical analysis conducted on geographies consisting of 199,397,267 people shows a mild positive correlation between the proportion of Northern Europeans and unemployment rate among seniors over the age of 75 in the United States with a correlation coefficient (R) of 0.332 and weighted average of 9.1%, a difference of 17.1%.
Unemployment Among Seniors over 75 years Correlation Summary
| Measurement | Immigrants from Spain | Northern European |
| Minimum | 3.6% | 5.7% |
| Maximum | 51.6% | 100.0% |
| Range | 48.0% | 94.3% |
| Mean | 13.5% | 24.7% |
| Median | 9.3% | 15.4% |
| Interquartile 25% (IQ1) | 6.6% | 9.6% |
| Interquartile 75% (IQ3) | 14.4% | 27.7% |
| Interquartile Range (IQR) | 7.8% | 18.1% |
| Standard Deviation (Sample) | 12.4% | 26.5% |
| Standard Deviation (Population) | 12.1% | 25.3% |
Similar Demographics by Unemployment Among Seniors over 75 years
Demographics Similar to Immigrants from Spain by Unemployment Among Seniors over 75 years
In terms of unemployment among seniors over 75 years, the demographic groups most similar to Immigrants from Spain are British West Indian (7.8%, a difference of 0.010%), Immigrants from Denmark (7.8%, a difference of 0.040%), Immigrants from China (7.8%, a difference of 0.070%), Pueblo (7.7%, a difference of 0.33%), and Creek (7.8%, a difference of 0.48%).
| Demographics | Rating | Rank | Unemployment Among Seniors over 75 years |
| Immigrants | Hungary | 100.0 /100 | #37 | Exceptional 7.7% |
| Kiowa | 100.0 /100 | #38 | Exceptional 7.7% |
| Ugandans | 100.0 /100 | #39 | Exceptional 7.7% |
| Colville | 100.0 /100 | #40 | Exceptional 7.7% |
| Immigrants | Burma/Myanmar | 100.0 /100 | #41 | Exceptional 7.7% |
| Pueblo | 100.0 /100 | #42 | Exceptional 7.7% |
| Immigrants | Denmark | 100.0 /100 | #43 | Exceptional 7.8% |
| Immigrants | Spain | 100.0 /100 | #44 | Exceptional 7.8% |
| British West Indians | 100.0 /100 | #45 | Exceptional 7.8% |
| Immigrants | China | 100.0 /100 | #46 | Exceptional 7.8% |
| Creek | 100.0 /100 | #47 | Exceptional 7.8% |
| Immigrants | Chile | 100.0 /100 | #48 | Exceptional 7.8% |
| Potawatomi | 100.0 /100 | #49 | Exceptional 7.8% |
| Immigrants | Latvia | 100.0 /100 | #50 | Exceptional 7.8% |
| Moroccans | 100.0 /100 | #51 | Exceptional 7.8% |
Demographics Similar to Northern Europeans by Unemployment Among Seniors over 75 years
In terms of unemployment among seniors over 75 years, the demographic groups most similar to Northern Europeans are Immigrants from Central America (9.1%, a difference of 0.0%), Hispanic or Latino (9.1%, a difference of 0.010%), African (9.1%, a difference of 0.020%), Yugoslavian (9.1%, a difference of 0.040%), and Vietnamese (9.1%, a difference of 0.090%).
| Demographics | Rating | Rank | Unemployment Among Seniors over 75 years |
| Immigrants | Jordan | 6.9 /100 | #223 | Tragic 9.0% |
| Costa Ricans | 6.3 /100 | #224 | Tragic 9.1% |
| Navajo | 6.1 /100 | #225 | Tragic 9.1% |
| Immigrants | Bangladesh | 5.9 /100 | #226 | Tragic 9.1% |
| Samoans | 5.7 /100 | #227 | Tragic 9.1% |
| Kenyans | 5.4 /100 | #228 | Tragic 9.1% |
| Hispanics or Latinos | 5.0 /100 | #229 | Tragic 9.1% |
| Northern Europeans | 4.9 /100 | #230 | Tragic 9.1% |
| Immigrants | Central America | 4.9 /100 | #231 | Tragic 9.1% |
| Africans | 4.9 /100 | #232 | Tragic 9.1% |
| Yugoslavians | 4.8 /100 | #233 | Tragic 9.1% |
| Vietnamese | 4.6 /100 | #234 | Tragic 9.1% |
| Panamanians | 4.0 /100 | #235 | Tragic 9.1% |
| Jordanians | 4.0 /100 | #236 | Tragic 9.1% |
| Houma | 3.9 /100 | #237 | Tragic 9.1% |