Immigrants from Spain vs South African 6th Grade
COMPARE
Immigrants from Spain
South African
6th Grade
6th Grade Comparison
Immigrants from Spain
South Africans
97.0%
6TH GRADE
39.9/ 100
METRIC RATING
180th/ 347
METRIC RANK
97.5%
6TH GRADE
98.2/ 100
METRIC RATING
101st/ 347
METRIC RANK
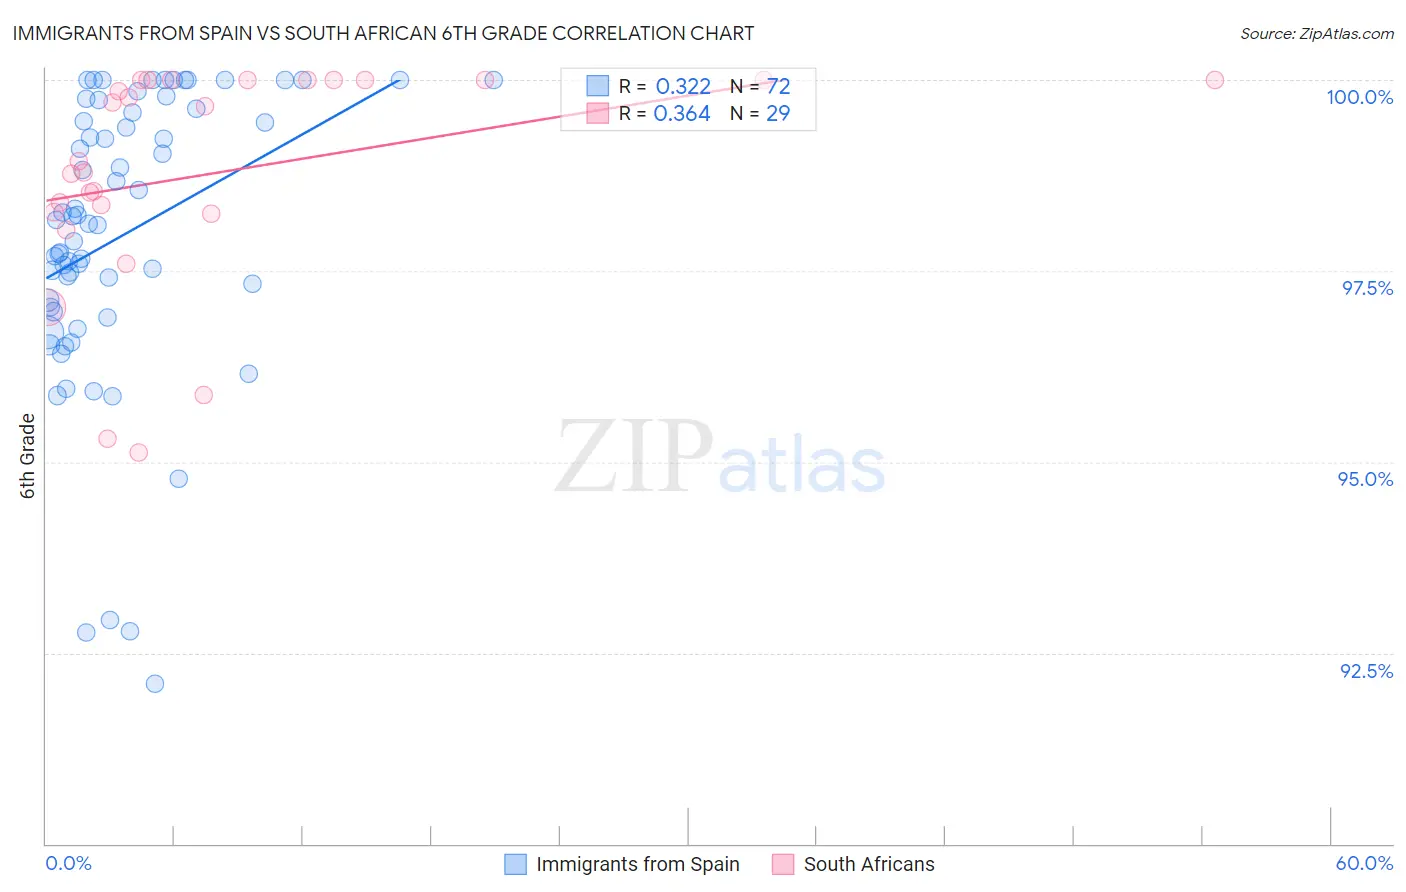
Immigrants from Spain vs South African 6th Grade Correlation Chart
The statistical analysis conducted on geographies consisting of 239,682,725 people shows a mild positive correlation between the proportion of Immigrants from Spain and percentage of population with at least 6th grade education in the United States with a correlation coefficient (R) of 0.322 and weighted average of 97.0%. Similarly, the statistical analysis conducted on geographies consisting of 182,604,532 people shows a mild positive correlation between the proportion of South Africans and percentage of population with at least 6th grade education in the United States with a correlation coefficient (R) of 0.364 and weighted average of 97.5%, a difference of 0.51%.
6th Grade Correlation Summary
| Measurement | Immigrants from Spain | South African |
| Minimum | 92.1% | 95.1% |
| Maximum | 100.0% | 100.0% |
| Range | 7.9% | 4.9% |
| Mean | 98.0% | 98.8% |
| Median | 98.1% | 98.9% |
| Interquartile 25% (IQ1) | 97.0% | 98.3% |
| Interquartile 75% (IQ3) | 99.6% | 100.0% |
| Interquartile Range (IQR) | 2.6% | 1.7% |
| Standard Deviation (Sample) | 1.9% | 1.4% |
| Standard Deviation (Population) | 1.9% | 1.4% |
Similar Demographics by 6th Grade
Demographics Similar to Immigrants from Spain by 6th Grade
In terms of 6th grade, the demographic groups most similar to Immigrants from Spain are Comanche (97.0%, a difference of 0.010%), Immigrants from Ukraine (97.0%, a difference of 0.020%), Immigrants from Kazakhstan (97.0%, a difference of 0.030%), Immigrants from Micronesia (97.0%, a difference of 0.030%), and Mongolian (97.0%, a difference of 0.030%).
| Demographics | Rating | Rank | 6th Grade |
| Arabs | 50.1 /100 | #173 | Average 97.0% |
| Venezuelans | 50.0 /100 | #174 | Average 97.0% |
| Immigrants | Kazakhstan | 47.3 /100 | #175 | Average 97.0% |
| Immigrants | Micronesia | 47.1 /100 | #176 | Average 97.0% |
| Mongolians | 46.7 /100 | #177 | Average 97.0% |
| Pakistanis | 46.0 /100 | #178 | Average 97.0% |
| Immigrants | Kenya | 45.3 /100 | #179 | Average 97.0% |
| Immigrants | Spain | 39.9 /100 | #180 | Fair 97.0% |
| Comanche | 37.9 /100 | #181 | Fair 97.0% |
| Immigrants | Ukraine | 35.6 /100 | #182 | Fair 97.0% |
| Immigrants | Venezuela | 34.5 /100 | #183 | Fair 97.0% |
| Spanish Americans | 33.5 /100 | #184 | Fair 97.0% |
| Argentineans | 33.0 /100 | #185 | Fair 97.0% |
| Immigrants | Egypt | 31.4 /100 | #186 | Fair 97.0% |
| Guamanians/Chamorros | 30.6 /100 | #187 | Fair 97.0% |
Demographics Similar to South Africans by 6th Grade
In terms of 6th grade, the demographic groups most similar to South Africans are Turkish (97.5%, a difference of 0.0%), Immigrants from Denmark (97.5%, a difference of 0.020%), Yugoslavian (97.5%, a difference of 0.020%), Choctaw (97.5%, a difference of 0.020%), and Bhutanese (97.5%, a difference of 0.020%).
| Demographics | Rating | Rank | 6th Grade |
| Cypriots | 98.7 /100 | #94 | Exceptional 97.5% |
| Immigrants | Ireland | 98.7 /100 | #95 | Exceptional 97.5% |
| Immigrants | Germany | 98.6 /100 | #96 | Exceptional 97.5% |
| Immigrants | Sweden | 98.6 /100 | #97 | Exceptional 97.5% |
| Immigrants | Denmark | 98.5 /100 | #98 | Exceptional 97.5% |
| Yugoslavians | 98.5 /100 | #99 | Exceptional 97.5% |
| Turks | 98.3 /100 | #100 | Exceptional 97.5% |
| South Africans | 98.2 /100 | #101 | Exceptional 97.5% |
| Choctaw | 98.0 /100 | #102 | Exceptional 97.5% |
| Bhutanese | 98.0 /100 | #103 | Exceptional 97.5% |
| German Russians | 97.9 /100 | #104 | Exceptional 97.5% |
| Cheyenne | 97.9 /100 | #105 | Exceptional 97.5% |
| Menominee | 97.7 /100 | #106 | Exceptional 97.5% |
| Immigrants | Singapore | 97.6 /100 | #107 | Exceptional 97.5% |
| Immigrants | Nonimmigrants | 97.3 /100 | #108 | Exceptional 97.4% |