Immigrants from Thailand vs Northern European 6th Grade
COMPARE
Immigrants from Thailand
Northern European
6th Grade
6th Grade Comparison
Immigrants from Thailand
Northern Europeans
96.3%
6TH GRADE
0.1/ 100
METRIC RATING
278th/ 347
METRIC RANK
97.8%
6TH GRADE
99.9/ 100
METRIC RATING
43rd/ 347
METRIC RANK
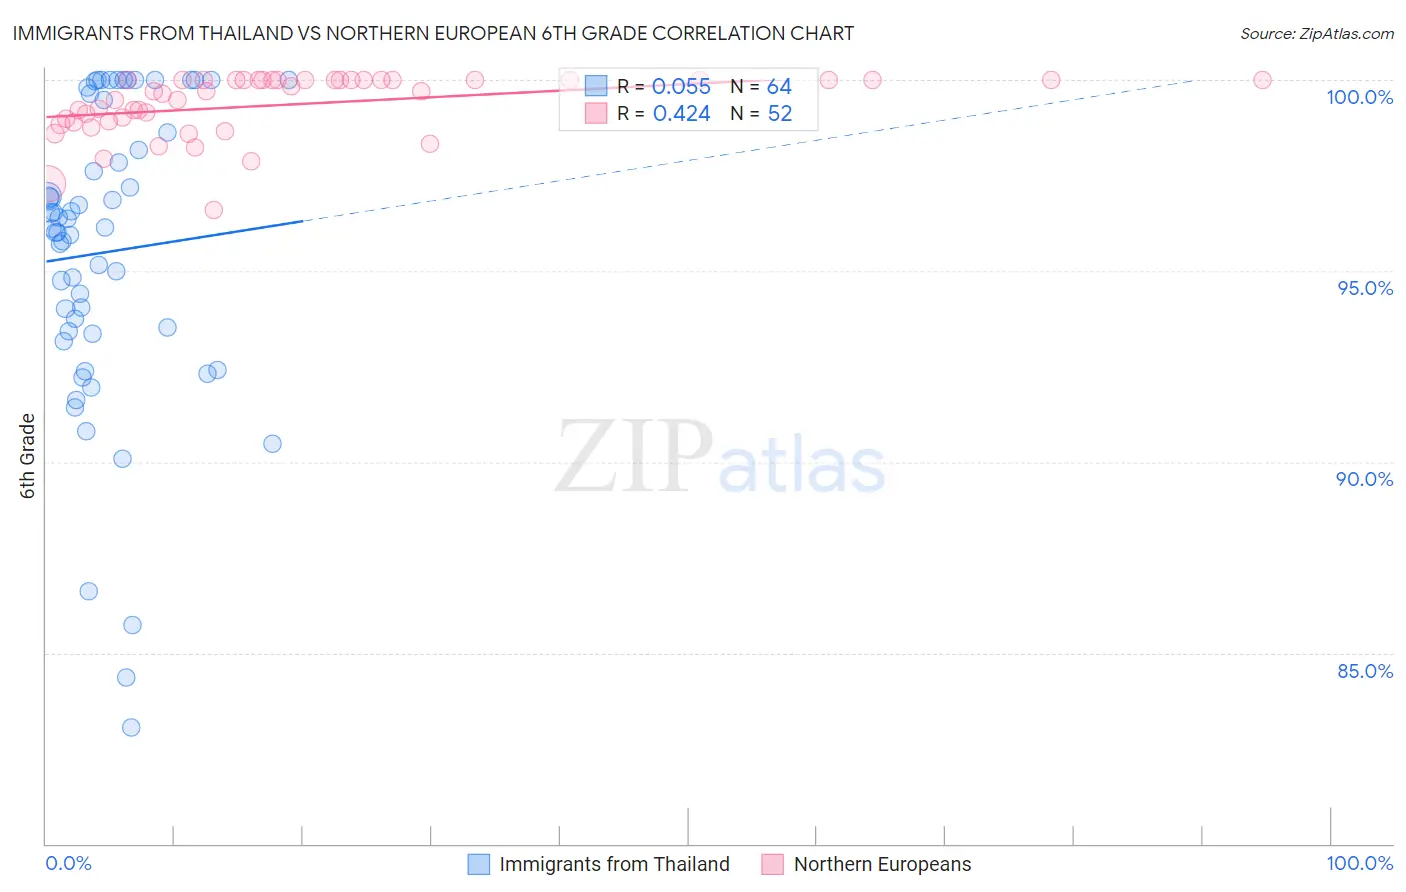
Immigrants from Thailand vs Northern European 6th Grade Correlation Chart
The statistical analysis conducted on geographies consisting of 317,022,916 people shows a slight positive correlation between the proportion of Immigrants from Thailand and percentage of population with at least 6th grade education in the United States with a correlation coefficient (R) of 0.055 and weighted average of 96.3%. Similarly, the statistical analysis conducted on geographies consisting of 406,093,361 people shows a moderate positive correlation between the proportion of Northern Europeans and percentage of population with at least 6th grade education in the United States with a correlation coefficient (R) of 0.424 and weighted average of 97.8%, a difference of 1.6%.
6th Grade Correlation Summary
| Measurement | Immigrants from Thailand | Northern European |
| Minimum | 83.0% | 96.6% |
| Maximum | 100.0% | 100.0% |
| Range | 17.0% | 3.4% |
| Mean | 95.5% | 99.4% |
| Median | 96.1% | 99.7% |
| Interquartile 25% (IQ1) | 93.4% | 98.9% |
| Interquartile 75% (IQ3) | 99.0% | 100.0% |
| Interquartile Range (IQR) | 5.7% | 1.1% |
| Standard Deviation (Sample) | 4.0% | 0.80% |
| Standard Deviation (Population) | 4.0% | 0.80% |
Similar Demographics by 6th Grade
Demographics Similar to Immigrants from Thailand by 6th Grade
In terms of 6th grade, the demographic groups most similar to Immigrants from Thailand are Immigrants from Western Africa (96.3%, a difference of 0.0%), Yaqui (96.3%, a difference of 0.010%), Immigrants from Peru (96.2%, a difference of 0.010%), Immigrants from Ghana (96.3%, a difference of 0.020%), and Immigrants from Afghanistan (96.2%, a difference of 0.020%).
| Demographics | Rating | Rank | 6th Grade |
| Immigrants | Hong Kong | 0.2 /100 | #271 | Tragic 96.3% |
| Immigrants | Bolivia | 0.1 /100 | #272 | Tragic 96.3% |
| Immigrants | Cameroon | 0.1 /100 | #273 | Tragic 96.3% |
| Immigrants | Philippines | 0.1 /100 | #274 | Tragic 96.3% |
| Immigrants | Ghana | 0.1 /100 | #275 | Tragic 96.3% |
| Yaqui | 0.1 /100 | #276 | Tragic 96.3% |
| Immigrants | Western Africa | 0.1 /100 | #277 | Tragic 96.3% |
| Immigrants | Thailand | 0.1 /100 | #278 | Tragic 96.3% |
| Immigrants | Peru | 0.1 /100 | #279 | Tragic 96.2% |
| Immigrants | Afghanistan | 0.1 /100 | #280 | Tragic 96.2% |
| Trinidadians and Tobagonians | 0.1 /100 | #281 | Tragic 96.2% |
| Houma | 0.1 /100 | #282 | Tragic 96.2% |
| Cubans | 0.1 /100 | #283 | Tragic 96.2% |
| Fijians | 0.1 /100 | #284 | Tragic 96.2% |
| Somalis | 0.1 /100 | #285 | Tragic 96.2% |
Demographics Similar to Northern Europeans by 6th Grade
In terms of 6th grade, the demographic groups most similar to Northern Europeans are Hungarian (97.8%, a difference of 0.010%), Eastern European (97.9%, a difference of 0.020%), Czechoslovakian (97.8%, a difference of 0.030%), Latvian (97.9%, a difference of 0.050%), and Bulgarian (97.8%, a difference of 0.050%).
| Demographics | Rating | Rank | 6th Grade |
| Italians | 100.0 /100 | #36 | Exceptional 97.9% |
| British | 100.0 /100 | #37 | Exceptional 97.9% |
| Belgians | 100.0 /100 | #38 | Exceptional 97.9% |
| Luxembourgers | 99.9 /100 | #39 | Exceptional 97.9% |
| Latvians | 99.9 /100 | #40 | Exceptional 97.9% |
| Eastern Europeans | 99.9 /100 | #41 | Exceptional 97.9% |
| Hungarians | 99.9 /100 | #42 | Exceptional 97.8% |
| Northern Europeans | 99.9 /100 | #43 | Exceptional 97.8% |
| Czechoslovakians | 99.9 /100 | #44 | Exceptional 97.8% |
| Bulgarians | 99.9 /100 | #45 | Exceptional 97.8% |
| Arapaho | 99.9 /100 | #46 | Exceptional 97.8% |
| Native Hawaiians | 99.9 /100 | #47 | Exceptional 97.8% |
| Celtics | 99.9 /100 | #48 | Exceptional 97.8% |
| Estonians | 99.8 /100 | #49 | Exceptional 97.8% |
| Immigrants | Scotland | 99.8 /100 | #50 | Exceptional 97.8% |