Immigrants from Jamaica vs Northern European 6th Grade
COMPARE
Immigrants from Jamaica
Northern European
6th Grade
6th Grade Comparison
Immigrants from Jamaica
Northern Europeans
96.4%
6TH GRADE
0.2/ 100
METRIC RATING
265th/ 347
METRIC RANK
97.8%
6TH GRADE
99.9/ 100
METRIC RATING
43rd/ 347
METRIC RANK
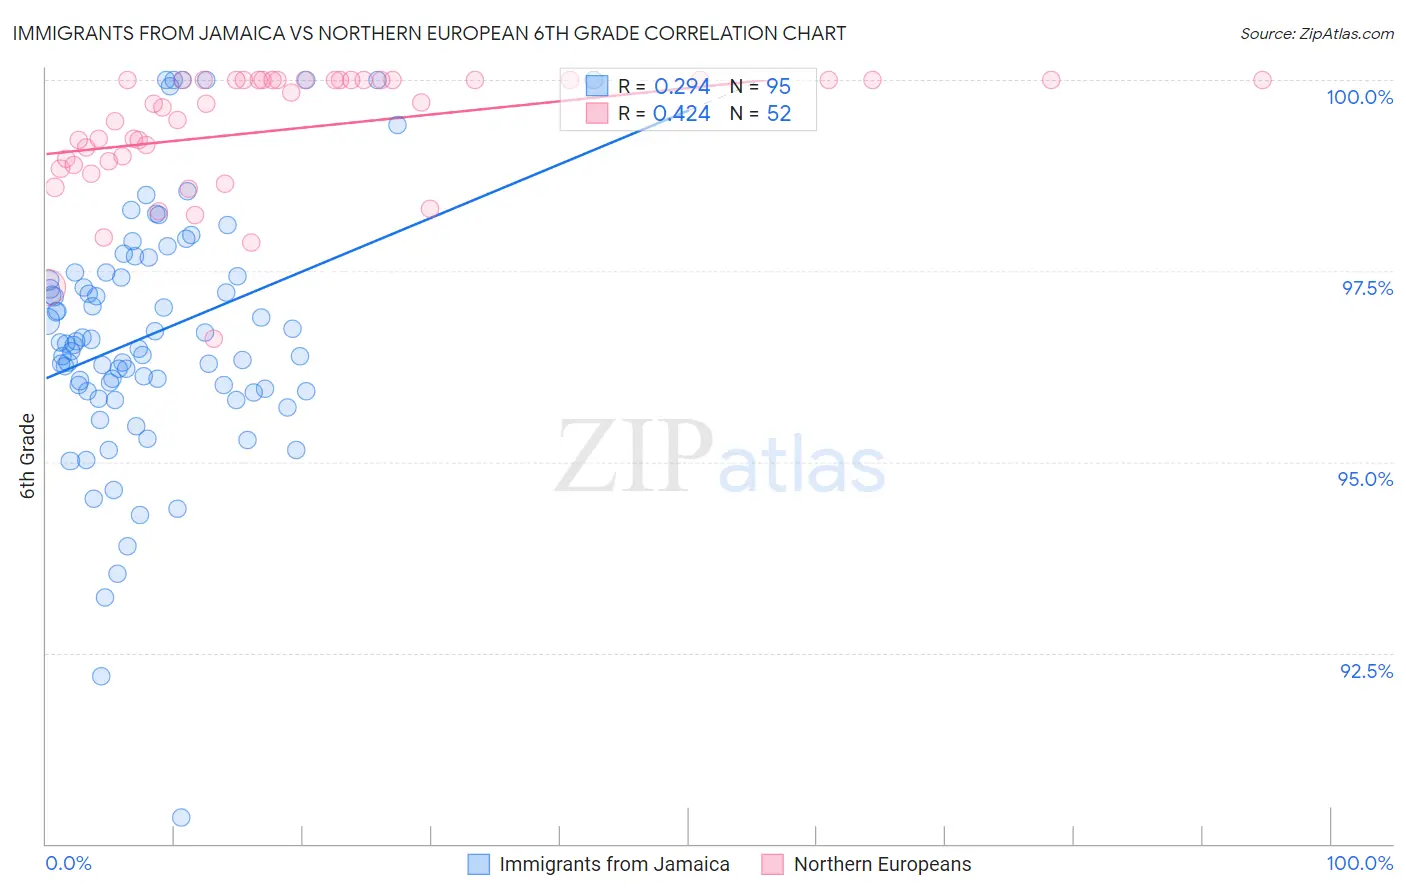
Immigrants from Jamaica vs Northern European 6th Grade Correlation Chart
The statistical analysis conducted on geographies consisting of 301,829,550 people shows a weak positive correlation between the proportion of Immigrants from Jamaica and percentage of population with at least 6th grade education in the United States with a correlation coefficient (R) of 0.294 and weighted average of 96.4%. Similarly, the statistical analysis conducted on geographies consisting of 406,093,361 people shows a moderate positive correlation between the proportion of Northern Europeans and percentage of population with at least 6th grade education in the United States with a correlation coefficient (R) of 0.424 and weighted average of 97.8%, a difference of 1.5%.
6th Grade Correlation Summary
| Measurement | Immigrants from Jamaica | Northern European |
| Minimum | 90.4% | 96.6% |
| Maximum | 100.0% | 100.0% |
| Range | 9.6% | 3.4% |
| Mean | 96.7% | 99.4% |
| Median | 96.6% | 99.7% |
| Interquartile 25% (IQ1) | 95.9% | 98.9% |
| Interquartile 75% (IQ3) | 97.5% | 100.0% |
| Interquartile Range (IQR) | 1.5% | 1.1% |
| Standard Deviation (Sample) | 1.7% | 0.80% |
| Standard Deviation (Population) | 1.7% | 0.80% |
Similar Demographics by 6th Grade
Demographics Similar to Immigrants from Jamaica by 6th Grade
In terms of 6th grade, the demographic groups most similar to Immigrants from Jamaica are Immigrants from Colombia (96.4%, a difference of 0.010%), Armenian (96.4%, a difference of 0.010%), Ghanaian (96.4%, a difference of 0.010%), Afghan (96.4%, a difference of 0.010%), and Immigrants from Nigeria (96.4%, a difference of 0.020%).
| Demographics | Rating | Rank | 6th Grade |
| Immigrants | China | 0.4 /100 | #258 | Tragic 96.4% |
| South Americans | 0.4 /100 | #259 | Tragic 96.4% |
| Peruvians | 0.4 /100 | #260 | Tragic 96.4% |
| Immigrants | Sierra Leone | 0.4 /100 | #261 | Tragic 96.4% |
| Immigrants | Nigeria | 0.3 /100 | #262 | Tragic 96.4% |
| Immigrants | Colombia | 0.3 /100 | #263 | Tragic 96.4% |
| Armenians | 0.3 /100 | #264 | Tragic 96.4% |
| Immigrants | Jamaica | 0.2 /100 | #265 | Tragic 96.4% |
| Ghanaians | 0.2 /100 | #266 | Tragic 96.4% |
| Afghans | 0.2 /100 | #267 | Tragic 96.4% |
| Immigrants | Uzbekistan | 0.2 /100 | #268 | Tragic 96.3% |
| West Indians | 0.2 /100 | #269 | Tragic 96.3% |
| Immigrants | South America | 0.2 /100 | #270 | Tragic 96.3% |
| Immigrants | Hong Kong | 0.2 /100 | #271 | Tragic 96.3% |
| Immigrants | Bolivia | 0.1 /100 | #272 | Tragic 96.3% |
Demographics Similar to Northern Europeans by 6th Grade
In terms of 6th grade, the demographic groups most similar to Northern Europeans are Hungarian (97.8%, a difference of 0.010%), Eastern European (97.9%, a difference of 0.020%), Czechoslovakian (97.8%, a difference of 0.030%), Latvian (97.9%, a difference of 0.050%), and Bulgarian (97.8%, a difference of 0.050%).
| Demographics | Rating | Rank | 6th Grade |
| Italians | 100.0 /100 | #36 | Exceptional 97.9% |
| British | 100.0 /100 | #37 | Exceptional 97.9% |
| Belgians | 100.0 /100 | #38 | Exceptional 97.9% |
| Luxembourgers | 99.9 /100 | #39 | Exceptional 97.9% |
| Latvians | 99.9 /100 | #40 | Exceptional 97.9% |
| Eastern Europeans | 99.9 /100 | #41 | Exceptional 97.9% |
| Hungarians | 99.9 /100 | #42 | Exceptional 97.8% |
| Northern Europeans | 99.9 /100 | #43 | Exceptional 97.8% |
| Czechoslovakians | 99.9 /100 | #44 | Exceptional 97.8% |
| Bulgarians | 99.9 /100 | #45 | Exceptional 97.8% |
| Arapaho | 99.9 /100 | #46 | Exceptional 97.8% |
| Native Hawaiians | 99.9 /100 | #47 | Exceptional 97.8% |
| Celtics | 99.9 /100 | #48 | Exceptional 97.8% |
| Estonians | 99.8 /100 | #49 | Exceptional 97.8% |
| Immigrants | Scotland | 99.8 /100 | #50 | Exceptional 97.8% |