Immigrants from Belarus vs Tongan 2nd Grade
COMPARE
Immigrants from Belarus
Tongan
2nd Grade
2nd Grade Comparison
Immigrants from Belarus
Tongans
97.8%
2ND GRADE
41.5/ 100
METRIC RATING
184th/ 347
METRIC RANK
97.6%
2ND GRADE
4.3/ 100
METRIC RATING
225th/ 347
METRIC RANK
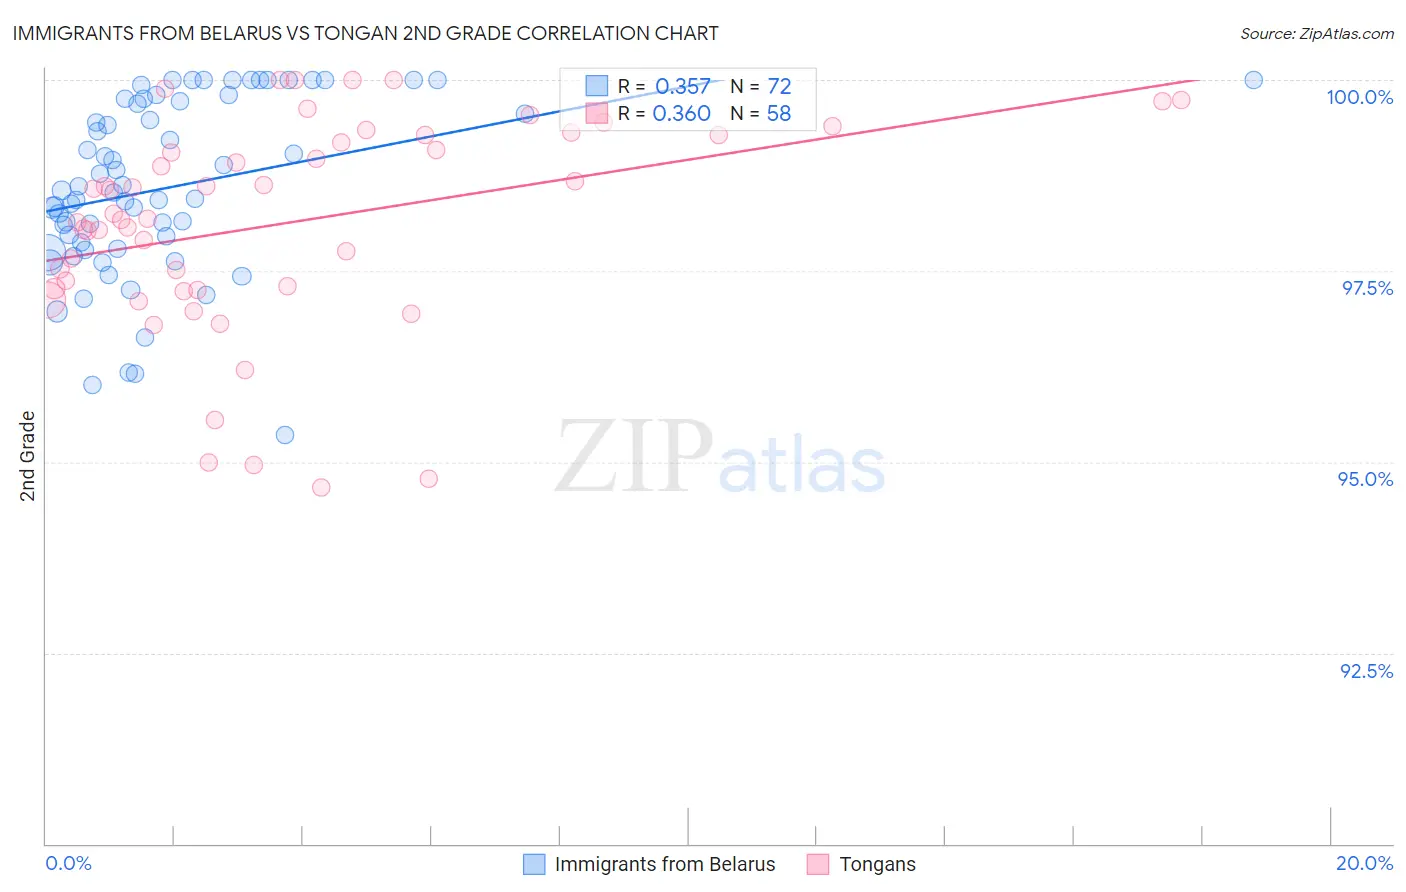
Immigrants from Belarus vs Tongan 2nd Grade Correlation Chart
The statistical analysis conducted on geographies consisting of 149,993,317 people shows a mild positive correlation between the proportion of Immigrants from Belarus and percentage of population with at least 2nd grade education in the United States with a correlation coefficient (R) of 0.357 and weighted average of 97.8%. Similarly, the statistical analysis conducted on geographies consisting of 102,908,759 people shows a mild positive correlation between the proportion of Tongans and percentage of population with at least 2nd grade education in the United States with a correlation coefficient (R) of 0.360 and weighted average of 97.6%, a difference of 0.22%.
2nd Grade Correlation Summary
| Measurement | Immigrants from Belarus | Tongan |
| Minimum | 95.4% | 94.7% |
| Maximum | 100.0% | 100.0% |
| Range | 4.6% | 5.3% |
| Mean | 98.6% | 98.1% |
| Median | 98.5% | 98.2% |
| Interquartile 25% (IQ1) | 97.8% | 97.3% |
| Interquartile 75% (IQ3) | 99.7% | 99.3% |
| Interquartile Range (IQR) | 1.9% | 2.0% |
| Standard Deviation (Sample) | 1.1% | 1.4% |
| Standard Deviation (Population) | 1.1% | 1.4% |
Similar Demographics by 2nd Grade
Demographics Similar to Immigrants from Belarus by 2nd Grade
In terms of 2nd grade, the demographic groups most similar to Immigrants from Belarus are Portuguese (97.8%, a difference of 0.0%), Immigrants from Poland (97.8%, a difference of 0.0%), Immigrants from Argentina (97.8%, a difference of 0.0%), Immigrants from Venezuela (97.9%, a difference of 0.010%), and Native/Alaskan (97.9%, a difference of 0.010%).
| Demographics | Rating | Rank | 2nd Grade |
| Immigrants | Brazil | 46.6 /100 | #177 | Average 97.9% |
| Argentineans | 46.3 /100 | #178 | Average 97.9% |
| Immigrants | Venezuela | 46.1 /100 | #179 | Average 97.9% |
| Natives/Alaskans | 44.3 /100 | #180 | Average 97.9% |
| Egyptians | 44.3 /100 | #181 | Average 97.9% |
| Portuguese | 42.4 /100 | #182 | Average 97.8% |
| Immigrants | Poland | 42.2 /100 | #183 | Average 97.8% |
| Immigrants | Belarus | 41.5 /100 | #184 | Average 97.8% |
| Immigrants | Argentina | 40.6 /100 | #185 | Average 97.8% |
| Arabs | 36.9 /100 | #186 | Fair 97.8% |
| Pakistanis | 36.1 /100 | #187 | Fair 97.8% |
| Immigrants | Kazakhstan | 35.6 /100 | #188 | Fair 97.8% |
| Panamanians | 33.5 /100 | #189 | Fair 97.8% |
| Immigrants | Taiwan | 31.8 /100 | #190 | Fair 97.8% |
| Paraguayans | 30.8 /100 | #191 | Fair 97.8% |
Demographics Similar to Tongans by 2nd Grade
In terms of 2nd grade, the demographic groups most similar to Tongans are Immigrants from Sudan (97.6%, a difference of 0.0%), Sierra Leonean (97.6%, a difference of 0.0%), Immigrants from Zaire (97.6%, a difference of 0.0%), Immigrants from Morocco (97.6%, a difference of 0.010%), and Iraqi (97.6%, a difference of 0.010%).
| Demographics | Rating | Rank | 2nd Grade |
| Sudanese | 5.7 /100 | #218 | Tragic 97.7% |
| Immigrants | Panama | 5.1 /100 | #219 | Tragic 97.6% |
| Immigrants | Morocco | 5.0 /100 | #220 | Tragic 97.6% |
| Iraqis | 4.6 /100 | #221 | Tragic 97.6% |
| Immigrants | Sudan | 4.5 /100 | #222 | Tragic 97.6% |
| Sierra Leoneans | 4.3 /100 | #223 | Tragic 97.6% |
| Immigrants | Zaire | 4.3 /100 | #224 | Tragic 97.6% |
| Tongans | 4.3 /100 | #225 | Tragic 97.6% |
| Immigrants | Syria | 4.0 /100 | #226 | Tragic 97.6% |
| Immigrants | Nepal | 4.0 /100 | #227 | Tragic 97.6% |
| Sub-Saharan Africans | 3.4 /100 | #228 | Tragic 97.6% |
| Immigrants | Costa Rica | 3.1 /100 | #229 | Tragic 97.6% |
| Senegalese | 3.1 /100 | #230 | Tragic 97.6% |
| Immigrants | Pakistan | 2.3 /100 | #231 | Tragic 97.6% |
| Immigrants | Western Asia | 2.1 /100 | #232 | Tragic 97.6% |