Immigrants from Southern Europe vs Luxembourger 6th Grade
COMPARE
Immigrants from Southern Europe
Luxembourger
6th Grade
6th Grade Comparison
Immigrants from Southern Europe
Luxembourgers
96.7%
6TH GRADE
4.4/ 100
METRIC RATING
224th/ 347
METRIC RANK
97.9%
6TH GRADE
99.9/ 100
METRIC RATING
39th/ 347
METRIC RANK
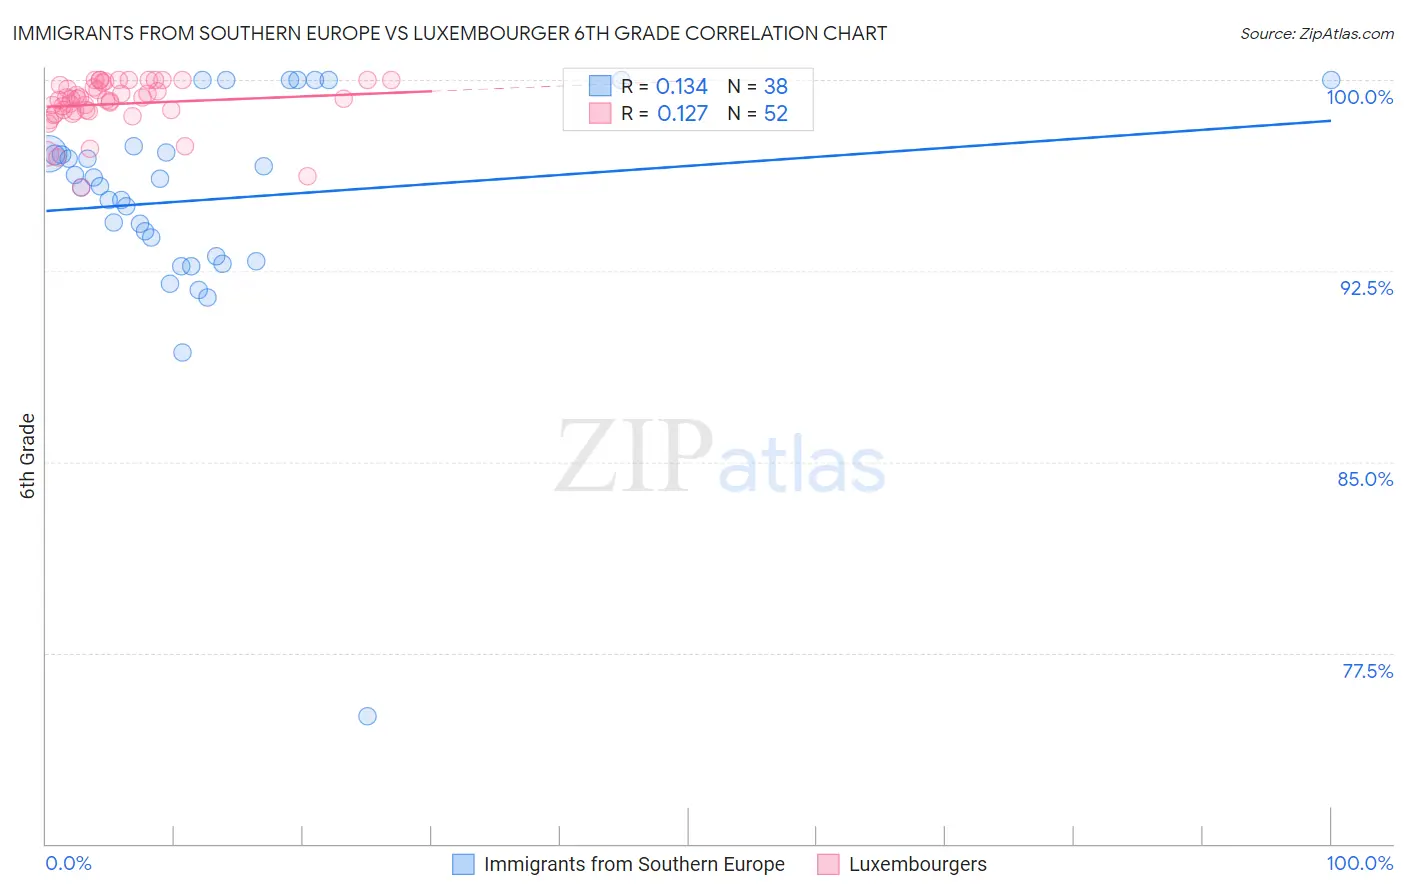
Immigrants from Southern Europe vs Luxembourger 6th Grade Correlation Chart
The statistical analysis conducted on geographies consisting of 402,804,595 people shows a poor positive correlation between the proportion of Immigrants from Southern Europe and percentage of population with at least 6th grade education in the United States with a correlation coefficient (R) of 0.134 and weighted average of 96.7%. Similarly, the statistical analysis conducted on geographies consisting of 144,675,512 people shows a poor positive correlation between the proportion of Luxembourgers and percentage of population with at least 6th grade education in the United States with a correlation coefficient (R) of 0.127 and weighted average of 97.9%, a difference of 1.2%.
6th Grade Correlation Summary
| Measurement | Immigrants from Southern Europe | Luxembourger |
| Minimum | 75.0% | 95.8% |
| Maximum | 100.0% | 100.0% |
| Range | 25.0% | 4.2% |
| Mean | 95.3% | 99.1% |
| Median | 96.0% | 99.3% |
| Interquartile 25% (IQ1) | 93.1% | 98.8% |
| Interquartile 75% (IQ3) | 97.2% | 99.9% |
| Interquartile Range (IQR) | 4.1% | 1.1% |
| Standard Deviation (Sample) | 4.4% | 0.98% |
| Standard Deviation (Population) | 4.4% | 0.97% |
Similar Demographics by 6th Grade
Demographics Similar to Immigrants from Southern Europe by 6th Grade
In terms of 6th grade, the demographic groups most similar to Immigrants from Southern Europe are Immigrants from Pakistan (96.7%, a difference of 0.0%), Bahamian (96.7%, a difference of 0.010%), Immigrants from Panama (96.7%, a difference of 0.010%), Immigrants from Western Asia (96.7%, a difference of 0.010%), and Immigrants from Malaysia (96.7%, a difference of 0.010%).
| Demographics | Rating | Rank | 6th Grade |
| Liberians | 7.5 /100 | #217 | Tragic 96.8% |
| Navajo | 7.3 /100 | #218 | Tragic 96.8% |
| Costa Ricans | 6.8 /100 | #219 | Tragic 96.8% |
| Immigrants | Morocco | 6.2 /100 | #220 | Tragic 96.7% |
| Tongans | 6.1 /100 | #221 | Tragic 96.7% |
| Immigrants | Syria | 5.9 /100 | #222 | Tragic 96.7% |
| Bahamians | 4.8 /100 | #223 | Tragic 96.7% |
| Immigrants | Southern Europe | 4.4 /100 | #224 | Tragic 96.7% |
| Immigrants | Pakistan | 4.4 /100 | #225 | Tragic 96.7% |
| Immigrants | Panama | 4.2 /100 | #226 | Tragic 96.7% |
| Immigrants | Western Asia | 4.1 /100 | #227 | Tragic 96.7% |
| Immigrants | Malaysia | 4.0 /100 | #228 | Tragic 96.7% |
| Assyrians/Chaldeans/Syriacs | 4.0 /100 | #229 | Tragic 96.7% |
| Immigrants | Eastern Asia | 4.0 /100 | #230 | Tragic 96.7% |
| Sub-Saharan Africans | 3.5 /100 | #231 | Tragic 96.7% |
Demographics Similar to Luxembourgers by 6th Grade
In terms of 6th grade, the demographic groups most similar to Luxembourgers are Belgian (97.9%, a difference of 0.0%), Latvian (97.9%, a difference of 0.010%), British (97.9%, a difference of 0.020%), Chinese (97.9%, a difference of 0.030%), and Italian (97.9%, a difference of 0.030%).
| Demographics | Rating | Rank | 6th Grade |
| Alaska Natives | 100.0 /100 | #32 | Exceptional 98.0% |
| Chippewa | 100.0 /100 | #33 | Exceptional 97.9% |
| Swiss | 100.0 /100 | #34 | Exceptional 97.9% |
| Chinese | 100.0 /100 | #35 | Exceptional 97.9% |
| Italians | 100.0 /100 | #36 | Exceptional 97.9% |
| British | 100.0 /100 | #37 | Exceptional 97.9% |
| Belgians | 100.0 /100 | #38 | Exceptional 97.9% |
| Luxembourgers | 99.9 /100 | #39 | Exceptional 97.9% |
| Latvians | 99.9 /100 | #40 | Exceptional 97.9% |
| Eastern Europeans | 99.9 /100 | #41 | Exceptional 97.9% |
| Hungarians | 99.9 /100 | #42 | Exceptional 97.8% |
| Northern Europeans | 99.9 /100 | #43 | Exceptional 97.8% |
| Czechoslovakians | 99.9 /100 | #44 | Exceptional 97.8% |
| Bulgarians | 99.9 /100 | #45 | Exceptional 97.8% |
| Arapaho | 99.9 /100 | #46 | Exceptional 97.8% |