Immigrants from Southern Europe vs Immigrants from Dominican Republic Master's Degree
COMPARE
Immigrants from Southern Europe
Immigrants from Dominican Republic
Master's Degree
Master's Degree Comparison
Immigrants from Southern Europe
Immigrants from Dominican Republic
16.6%
MASTER'S DEGREE
97.2/ 100
METRIC RATING
116th/ 347
METRIC RANK
12.1%
MASTER'S DEGREE
0.2/ 100
METRIC RATING
280th/ 347
METRIC RANK
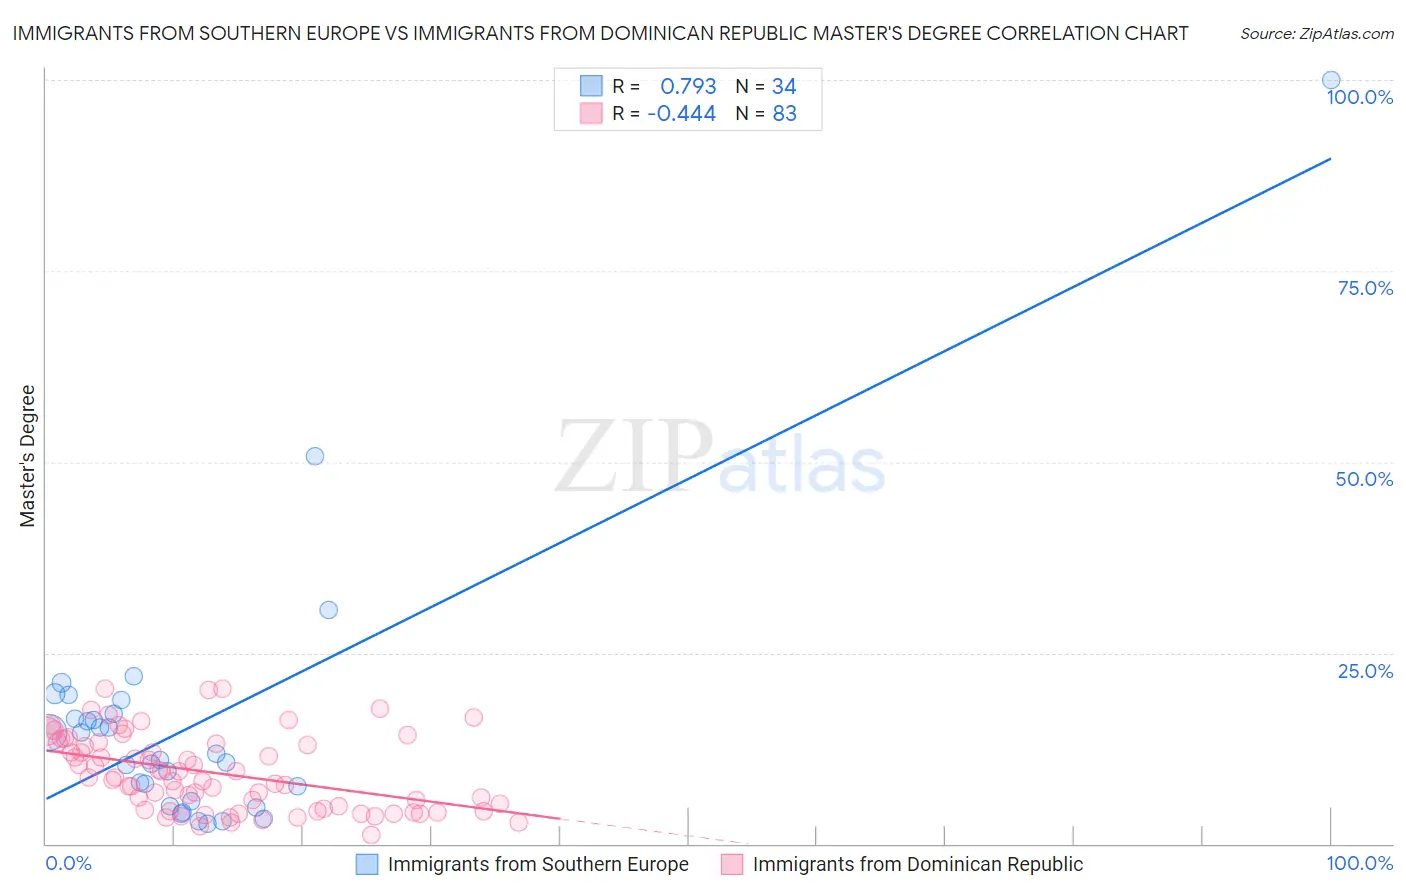
Immigrants from Southern Europe vs Immigrants from Dominican Republic Master's Degree Correlation Chart
The statistical analysis conducted on geographies consisting of 402,732,605 people shows a strong positive correlation between the proportion of Immigrants from Southern Europe and percentage of population with at least master's degree education in the United States with a correlation coefficient (R) of 0.793 and weighted average of 16.6%. Similarly, the statistical analysis conducted on geographies consisting of 275,069,954 people shows a moderate negative correlation between the proportion of Immigrants from Dominican Republic and percentage of population with at least master's degree education in the United States with a correlation coefficient (R) of -0.444 and weighted average of 12.1%, a difference of 37.9%.
Master's Degree Correlation Summary
| Measurement | Immigrants from Southern Europe | Immigrants from Dominican Republic |
| Minimum | 2.6% | 1.2% |
| Maximum | 100.0% | 20.3% |
| Range | 97.4% | 19.1% |
| Mean | 15.6% | 9.3% |
| Median | 11.4% | 8.6% |
| Interquartile 25% (IQ1) | 5.6% | 4.4% |
| Interquartile 75% (IQ3) | 17.0% | 13.2% |
| Interquartile Range (IQR) | 11.3% | 8.7% |
| Standard Deviation (Sample) | 17.6% | 4.9% |
| Standard Deviation (Population) | 17.4% | 4.9% |
Similar Demographics by Master's Degree
Demographics Similar to Immigrants from Southern Europe by Master's Degree
In terms of master's degree, the demographic groups most similar to Immigrants from Southern Europe are Immigrants from Moldova (16.6%, a difference of 0.010%), Immigrants from Uganda (16.6%, a difference of 0.12%), Northern European (16.7%, a difference of 0.42%), Brazilian (16.5%, a difference of 0.43%), and Arab (16.7%, a difference of 0.49%).
| Demographics | Rating | Rank | Master's Degree |
| Moroccans | 98.0 /100 | #109 | Exceptional 16.8% |
| Immigrants | Chile | 98.0 /100 | #110 | Exceptional 16.8% |
| Austrians | 97.8 /100 | #111 | Exceptional 16.7% |
| Macedonians | 97.7 /100 | #112 | Exceptional 16.7% |
| Arabs | 97.7 /100 | #113 | Exceptional 16.7% |
| Northern Europeans | 97.6 /100 | #114 | Exceptional 16.7% |
| Immigrants | Uganda | 97.3 /100 | #115 | Exceptional 16.6% |
| Immigrants | Southern Europe | 97.2 /100 | #116 | Exceptional 16.6% |
| Immigrants | Moldova | 97.2 /100 | #117 | Exceptional 16.6% |
| Brazilians | 96.8 /100 | #118 | Exceptional 16.5% |
| Jordanians | 96.5 /100 | #119 | Exceptional 16.5% |
| Lebanese | 96.4 /100 | #120 | Exceptional 16.5% |
| Afghans | 96.2 /100 | #121 | Exceptional 16.5% |
| British | 95.6 /100 | #122 | Exceptional 16.4% |
| Croatians | 95.6 /100 | #123 | Exceptional 16.4% |
Demographics Similar to Immigrants from Dominican Republic by Master's Degree
In terms of master's degree, the demographic groups most similar to Immigrants from Dominican Republic are Immigrants from Belize (12.1%, a difference of 0.060%), Malaysian (12.0%, a difference of 0.12%), Potawatomi (12.1%, a difference of 0.13%), Immigrants from Caribbean (12.1%, a difference of 0.14%), and Black/African American (12.1%, a difference of 0.15%).
| Demographics | Rating | Rank | Master's Degree |
| Blackfeet | 0.3 /100 | #273 | Tragic 12.1% |
| Cape Verdeans | 0.3 /100 | #274 | Tragic 12.1% |
| Cubans | 0.3 /100 | #275 | Tragic 12.1% |
| Blacks/African Americans | 0.3 /100 | #276 | Tragic 12.1% |
| Immigrants | Caribbean | 0.3 /100 | #277 | Tragic 12.1% |
| Potawatomi | 0.3 /100 | #278 | Tragic 12.1% |
| Immigrants | Belize | 0.2 /100 | #279 | Tragic 12.1% |
| Immigrants | Dominican Republic | 0.2 /100 | #280 | Tragic 12.1% |
| Malaysians | 0.2 /100 | #281 | Tragic 12.0% |
| Immigrants | El Salvador | 0.2 /100 | #282 | Tragic 12.0% |
| Hondurans | 0.2 /100 | #283 | Tragic 11.9% |
| Ottawa | 0.2 /100 | #284 | Tragic 11.9% |
| Immigrants | Nicaragua | 0.2 /100 | #285 | Tragic 11.8% |
| Aleuts | 0.1 /100 | #286 | Tragic 11.8% |
| Immigrants | Haiti | 0.1 /100 | #287 | Tragic 11.8% |