Immigrants from Southern Europe vs Blackfeet Doctorate Degree
COMPARE
Immigrants from Southern Europe
Blackfeet
Doctorate Degree
Doctorate Degree Comparison
Immigrants from Southern Europe
Blackfeet
2.0%
DOCTORATE DEGREE
94.7/ 100
METRIC RATING
122nd/ 347
METRIC RANK
1.5%
DOCTORATE DEGREE
0.7/ 100
METRIC RATING
264th/ 347
METRIC RANK
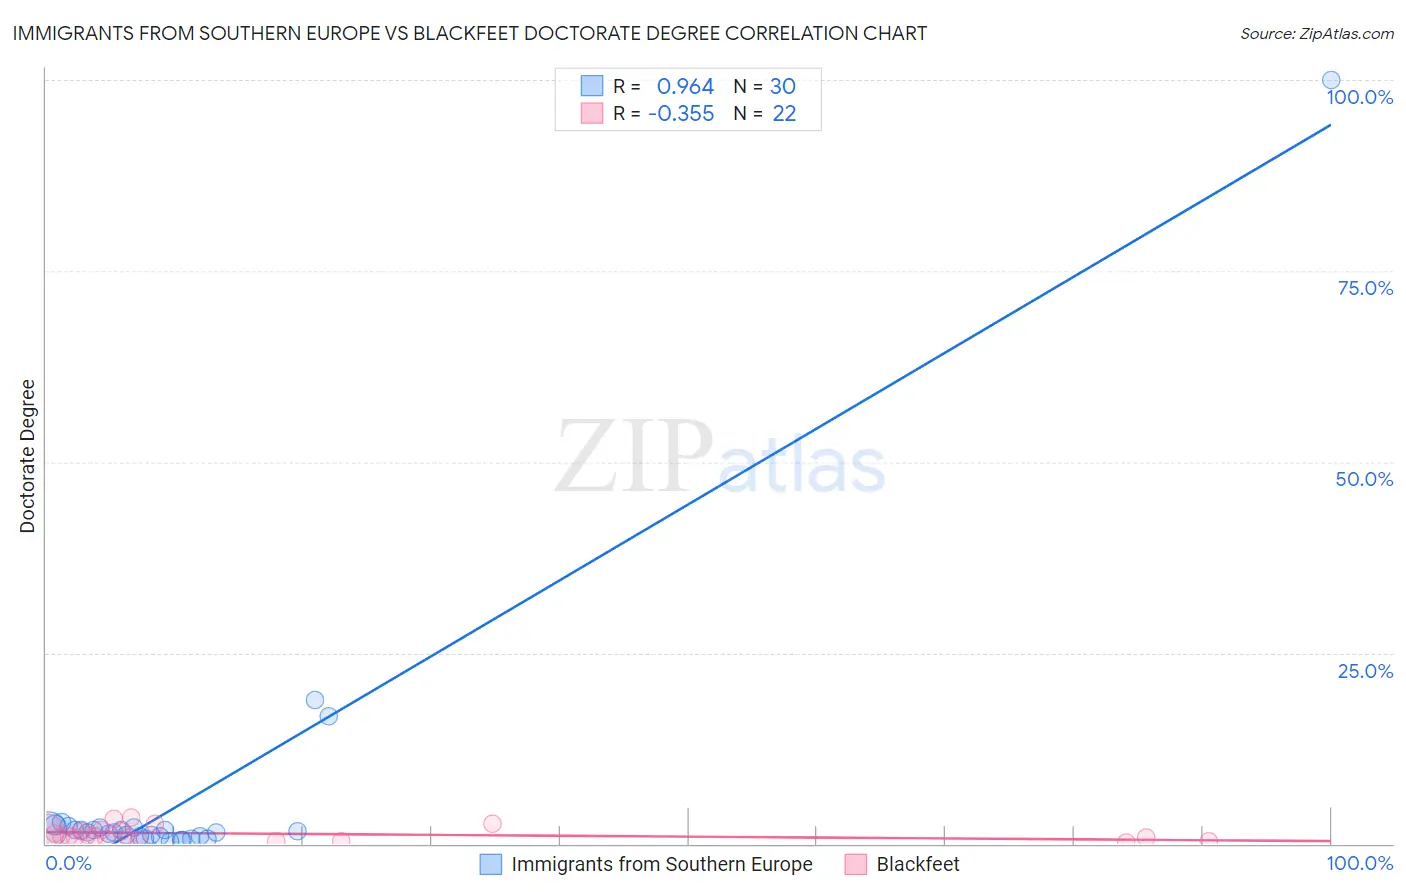
Immigrants from Southern Europe vs Blackfeet Doctorate Degree Correlation Chart
The statistical analysis conducted on geographies consisting of 399,415,289 people shows a perfect positive correlation between the proportion of Immigrants from Southern Europe and percentage of population with at least doctorate degree education in the United States with a correlation coefficient (R) of 0.964 and weighted average of 2.0%. Similarly, the statistical analysis conducted on geographies consisting of 304,903,722 people shows a mild negative correlation between the proportion of Blackfeet and percentage of population with at least doctorate degree education in the United States with a correlation coefficient (R) of -0.355 and weighted average of 1.5%, a difference of 35.2%.
Doctorate Degree Correlation Summary
| Measurement | Immigrants from Southern Europe | Blackfeet |
| Minimum | 0.40% | 0.095% |
| Maximum | 100.0% | 3.4% |
| Range | 99.6% | 3.3% |
| Mean | 5.8% | 1.3% |
| Median | 1.5% | 1.0% |
| Interquartile 25% (IQ1) | 1.0% | 0.67% |
| Interquartile 75% (IQ3) | 2.1% | 1.7% |
| Interquartile Range (IQR) | 1.1% | 1.00% |
| Standard Deviation (Sample) | 18.3% | 0.95% |
| Standard Deviation (Population) | 18.0% | 0.93% |
Similar Demographics by Doctorate Degree
Demographics Similar to Immigrants from Southern Europe by Doctorate Degree
In terms of doctorate degree, the demographic groups most similar to Immigrants from Southern Europe are Immigrants from Jordan (2.0%, a difference of 0.030%), Croatian (2.0%, a difference of 0.46%), Immigrants from Morocco (2.0%, a difference of 0.50%), Pakistani (2.0%, a difference of 0.79%), and Icelander (2.1%, a difference of 0.92%).
| Demographics | Rating | Rank | Doctorate Degree |
| Taiwanese | 96.7 /100 | #115 | Exceptional 2.1% |
| Maltese | 96.2 /100 | #116 | Exceptional 2.1% |
| Lebanese | 96.0 /100 | #117 | Exceptional 2.1% |
| Icelanders | 96.0 /100 | #118 | Exceptional 2.1% |
| Pakistanis | 95.8 /100 | #119 | Exceptional 2.0% |
| Immigrants | Morocco | 95.5 /100 | #120 | Exceptional 2.0% |
| Immigrants | Jordan | 94.8 /100 | #121 | Exceptional 2.0% |
| Immigrants | Southern Europe | 94.7 /100 | #122 | Exceptional 2.0% |
| Croatians | 94.0 /100 | #123 | Exceptional 2.0% |
| Ute | 93.2 /100 | #124 | Exceptional 2.0% |
| Moroccans | 93.0 /100 | #125 | Exceptional 2.0% |
| Jordanians | 92.1 /100 | #126 | Exceptional 2.0% |
| Palestinians | 92.0 /100 | #127 | Exceptional 2.0% |
| Immigrants | Zaire | 91.1 /100 | #128 | Exceptional 2.0% |
| Canadians | 90.6 /100 | #129 | Exceptional 2.0% |
Demographics Similar to Blackfeet by Doctorate Degree
In terms of doctorate degree, the demographic groups most similar to Blackfeet are Immigrants from Bahamas (1.5%, a difference of 0.18%), Nicaraguan (1.5%, a difference of 0.28%), Chickasaw (1.5%, a difference of 0.36%), Immigrants from Portugal (1.5%, a difference of 0.51%), and Japanese (1.5%, a difference of 0.97%).
| Demographics | Rating | Rank | Doctorate Degree |
| Chippewa | 0.9 /100 | #257 | Tragic 1.5% |
| Immigrants | West Indies | 0.9 /100 | #258 | Tragic 1.5% |
| Liberians | 0.9 /100 | #259 | Tragic 1.5% |
| Japanese | 0.9 /100 | #260 | Tragic 1.5% |
| Immigrants | Portugal | 0.8 /100 | #261 | Tragic 1.5% |
| Chickasaw | 0.7 /100 | #262 | Tragic 1.5% |
| Immigrants | Bahamas | 0.7 /100 | #263 | Tragic 1.5% |
| Blackfeet | 0.7 /100 | #264 | Tragic 1.5% |
| Nicaraguans | 0.6 /100 | #265 | Tragic 1.5% |
| Immigrants | Liberia | 0.5 /100 | #266 | Tragic 1.5% |
| Kiowa | 0.5 /100 | #267 | Tragic 1.5% |
| U.S. Virgin Islanders | 0.5 /100 | #268 | Tragic 1.5% |
| Crow | 0.5 /100 | #269 | Tragic 1.5% |
| Salvadorans | 0.5 /100 | #270 | Tragic 1.5% |
| Immigrants | Trinidad and Tobago | 0.5 /100 | #271 | Tragic 1.5% |