West Indian vs Creek Nursery School
COMPARE
West Indian
Creek
Nursery School
Nursery School Comparison
West Indians
Creek
97.5%
NURSERY SCHOOL
0.3/ 100
METRIC RATING
268th/ 347
METRIC RANK
98.4%
NURSERY SCHOOL
99.7/ 100
METRIC RATING
62nd/ 347
METRIC RANK
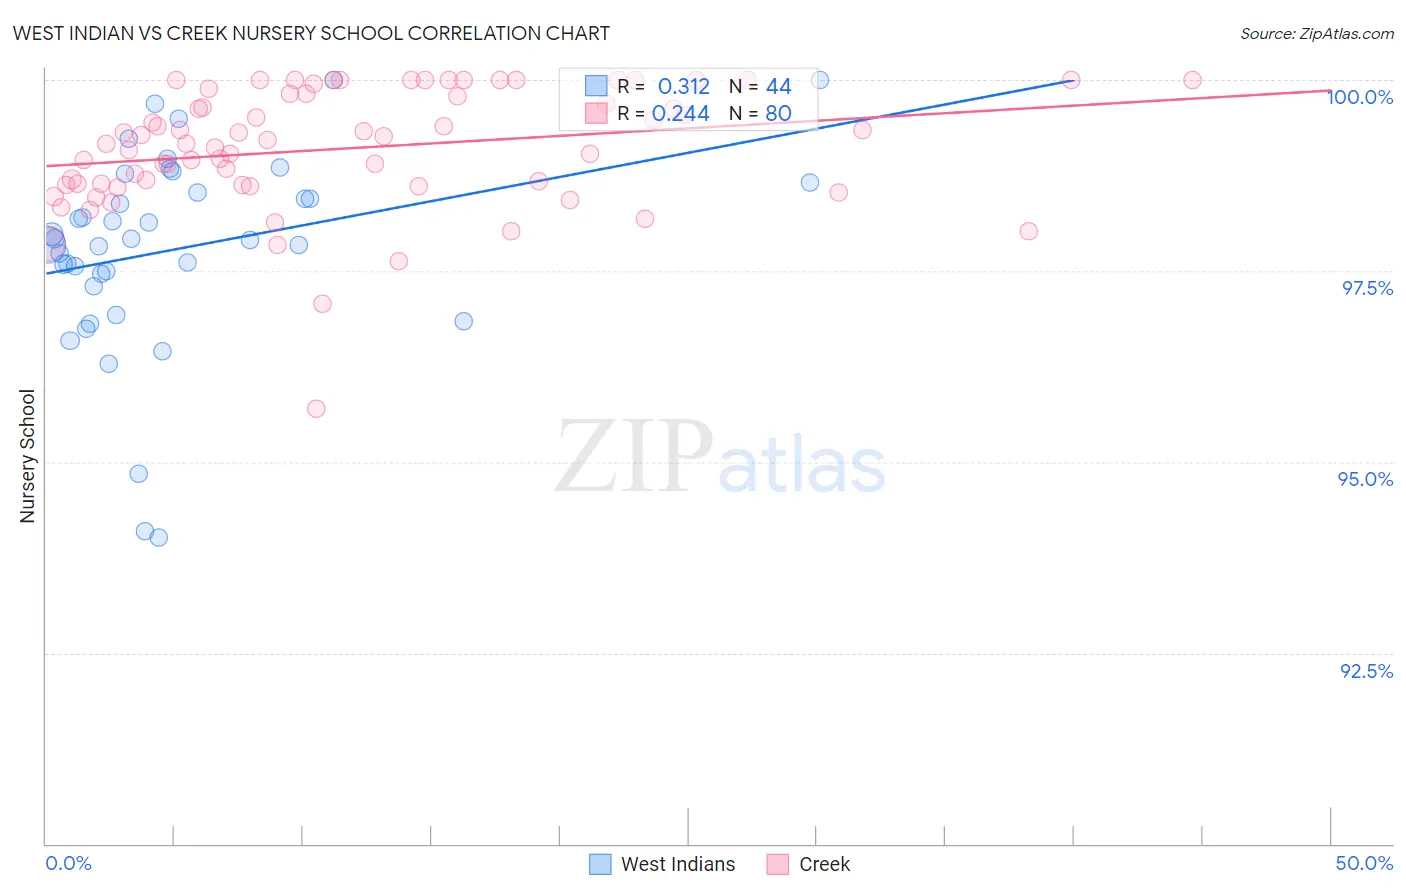
West Indian vs Creek Nursery School Correlation Chart
The statistical analysis conducted on geographies consisting of 254,063,654 people shows a mild positive correlation between the proportion of West Indians and percentage of population with at least nursery school education in the United States with a correlation coefficient (R) of 0.312 and weighted average of 97.5%. Similarly, the statistical analysis conducted on geographies consisting of 178,480,663 people shows a weak positive correlation between the proportion of Creek and percentage of population with at least nursery school education in the United States with a correlation coefficient (R) of 0.244 and weighted average of 98.4%, a difference of 0.90%.
Nursery School Correlation Summary
| Measurement | West Indian | Creek |
| Minimum | 94.0% | 95.7% |
| Maximum | 100.0% | 100.0% |
| Range | 6.0% | 4.3% |
| Mean | 97.8% | 99.1% |
| Median | 97.9% | 99.2% |
| Interquartile 25% (IQ1) | 97.4% | 98.6% |
| Interquartile 75% (IQ3) | 98.6% | 99.8% |
| Interquartile Range (IQR) | 1.2% | 1.2% |
| Standard Deviation (Sample) | 1.3% | 0.79% |
| Standard Deviation (Population) | 1.3% | 0.79% |
Similar Demographics by Nursery School
Demographics Similar to West Indians by Nursery School
In terms of nursery school, the demographic groups most similar to West Indians are Immigrants from Nigeria (97.5%, a difference of 0.0%), Immigrants from Liberia (97.5%, a difference of 0.0%), Immigrants from Sierra Leone (97.6%, a difference of 0.010%), Immigrants from Jamaica (97.5%, a difference of 0.010%), and Fijian (97.6%, a difference of 0.020%).
| Demographics | Rating | Rank | Nursery School |
| Cubans | 0.4 /100 | #261 | Tragic 97.6% |
| Immigrants | Ethiopia | 0.4 /100 | #262 | Tragic 97.6% |
| Fijians | 0.3 /100 | #263 | Tragic 97.6% |
| Taiwanese | 0.3 /100 | #264 | Tragic 97.6% |
| Assyrians/Chaldeans/Syriacs | 0.3 /100 | #265 | Tragic 97.6% |
| Immigrants | Sierra Leone | 0.3 /100 | #266 | Tragic 97.6% |
| Immigrants | Nigeria | 0.3 /100 | #267 | Tragic 97.5% |
| West Indians | 0.3 /100 | #268 | Tragic 97.5% |
| Immigrants | Liberia | 0.3 /100 | #269 | Tragic 97.5% |
| Immigrants | Jamaica | 0.2 /100 | #270 | Tragic 97.5% |
| Immigrants | Peru | 0.2 /100 | #271 | Tragic 97.5% |
| Immigrants | Bolivia | 0.1 /100 | #272 | Tragic 97.5% |
| Immigrants | China | 0.1 /100 | #273 | Tragic 97.5% |
| Immigrants | Cameroon | 0.1 /100 | #274 | Tragic 97.5% |
| Ghanaians | 0.1 /100 | #275 | Tragic 97.5% |
Demographics Similar to Creek by Nursery School
In terms of nursery school, the demographic groups most similar to Creek are Immigrants from Canada (98.4%, a difference of 0.0%), Slavic (98.4%, a difference of 0.0%), New Zealander (98.4%, a difference of 0.0%), Immigrants from North America (98.4%, a difference of 0.0%), and Greek (98.4%, a difference of 0.0%).
| Demographics | Rating | Rank | Nursery School |
| Immigrants | Scotland | 99.8 /100 | #55 | Exceptional 98.4% |
| Americans | 99.8 /100 | #56 | Exceptional 98.4% |
| Austrians | 99.8 /100 | #57 | Exceptional 98.4% |
| Bulgarians | 99.8 /100 | #58 | Exceptional 98.4% |
| Immigrants | Canada | 99.8 /100 | #59 | Exceptional 98.4% |
| Slavs | 99.8 /100 | #60 | Exceptional 98.4% |
| New Zealanders | 99.7 /100 | #61 | Exceptional 98.4% |
| Creek | 99.7 /100 | #62 | Exceptional 98.4% |
| Immigrants | North America | 99.7 /100 | #63 | Exceptional 98.4% |
| Greeks | 99.7 /100 | #64 | Exceptional 98.4% |
| Maltese | 99.7 /100 | #65 | Exceptional 98.4% |
| Canadians | 99.7 /100 | #66 | Exceptional 98.4% |
| Immigrants | Northern Europe | 99.6 /100 | #67 | Exceptional 98.4% |
| Russians | 99.6 /100 | #68 | Exceptional 98.4% |
| Immigrants | Austria | 99.6 /100 | #69 | Exceptional 98.4% |